Customer Insights
Customer Insights is a visual analytics tool that helps you understand how users interact with your experiences. It gives you a clear view of customer behaviors and purchase patterns, helping you spot drop-off points and discover what drives conversions.
Navigating Customer Insights
To access Customer Insights, go to Zoovu Home and open the Insights Dashboard.
Insights Dashboard
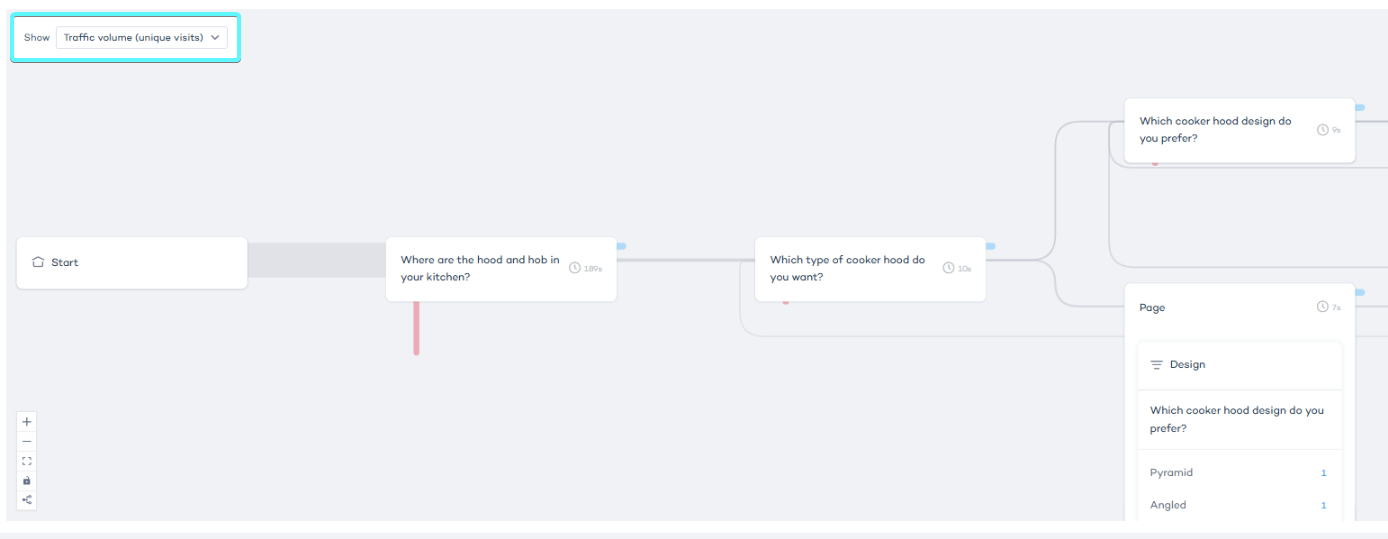
The Insights Dashboard visualizes how users interact with your experience. By default, it displays traffic volume based on unique visits.
Click the "Show" button to choose from different views:
- traffic volume (all actions) - default view showing every time the action was taken, even if repeated in the same user's session.
- clickthroughs influenced by the flow (shows product interaction volume per path)
- revenue impact (shows how much revenue each question, answer, or path influenced)
- traffic overview,
- traffic volume (unique actions) - each action once per user's session, even if repeated.
Insights Explorer
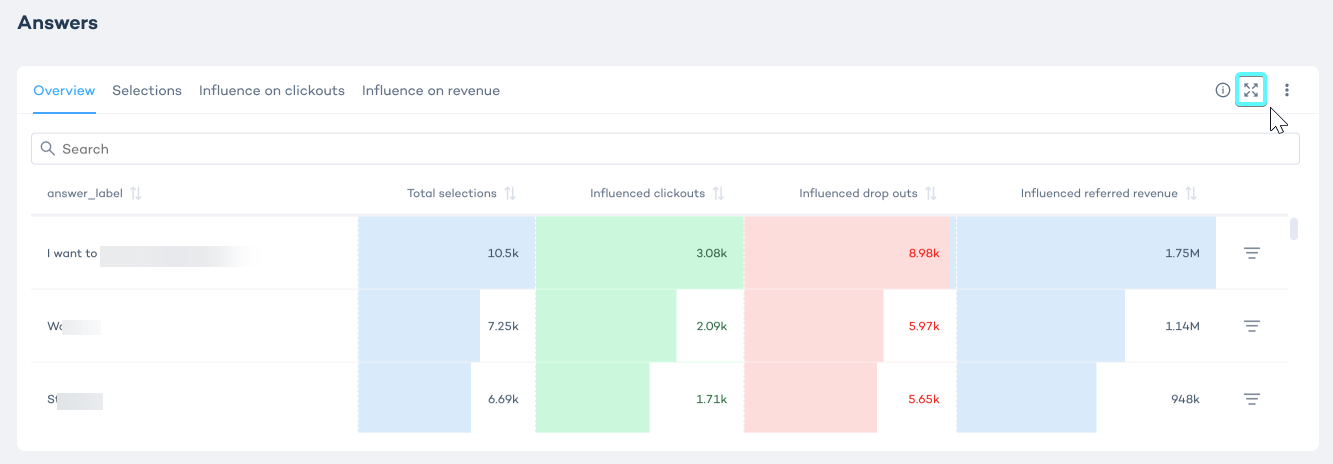
The Insights Explorer tab includes four data tables:
- Question trends and insights: review performance of each question.
- Answer trends and insights: see which answers were selected and how often.
- Product recommendation insights: track product clicks, revenue, and engagement.
- Paths insights: explore top-performing user journeys.
Each table supports cross-filtering.
- Click the funnel icon next to any item to apply a filter.
- All tables will update to reflect your selection
- You can add multiple filters or remove them one by one
Filters in the details tab are only applied to the data tables and don’t affect the visualized paths.
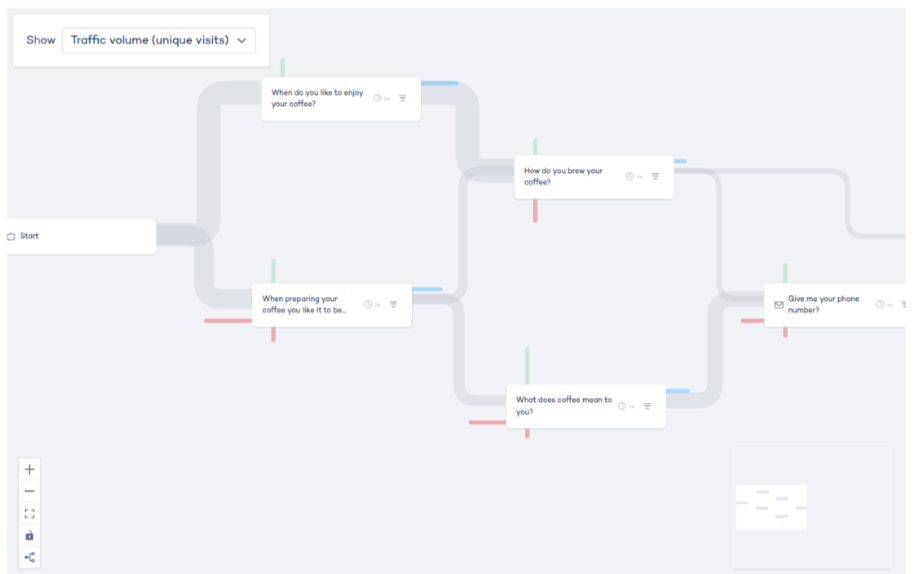
Analyzing user movement through the experience
In your discovery experiences, each route represents a transition between two questions in the Q&A flow. In the Insights Dashboard, routes are color-coded based on the type of user interaction:
- Forward routes (blue): Represent traffic from the "Next" button clicks, moving users forward through the experience.
- Reverse routes (red): Represent traffic from start-overs or back button clicks.
- Page selector routes (yellow): Represent traffic from page selections, like breadcrumbs or page selectors.
Active routes are highlighted in color, while inactive routes appear dim or greyed out.
Forward vs. reverse routes
Forward routes are active when users progress through the experience. You can view these routes when:
- The question is part of the ongoing flow.
- The source or target question is active.
- The route is tied to a selected answer.
Reverse routes occur when users navigate backward or restart the configuration flow. This can happen when a user clicks “Back” or returns to a previous question in the guided experience.
The system highlights potential user paths, even if they're not directly connected to the current question, to give you a broad view of the experience’s flow.
Analyzing a single question
Select a question in your flow to see a set of metrics that show how users interacted with it:
- Went forward: How many users continued the flow after this question. That includes users who clicked on an answer and those who clicked the next button without selecting an answer.
- Dropped out: Users who left the experience at this question.
- Went backwards: Users who clicked to go to a previous question
- Clickthroughs: How often answers or buttons in this question led to further actions (like clicking a product or link).
- Changed question using navigation: Users who switched to a different question using breadcrumbs or the top navigation.
- Average time spent: How long users stayed on this question before moving on.
Answer and forward counts
When you select a question in the flow:
- "Went forward" includes both users who clicked Next and those who selected an answer. This number may be higher than the total number of answers selected.
- Answer selections include repeated answers. For example, if a user went back and chose a different option, both selections are counted. That’s why the total you see in the flow might be higher than the number of answer interactions shown for the question.
Analyzing multiple questions
The multiquestion state helps you analyze more complex moments in the user journey, where multiple inputs guide what comes next.
Each question is listed on its own row inside the container. Next to each question, you’ll see an icon that shows its type, such as Grouped Question or Conversation Optimizer question. (Hover over the icon to see a tooltip with the question type name.)
There are no routes shown between questions inside this container (because they are on the same page). Routes appear only for the whole container, showing what happens after the user finishes the page.
- Click on a question to expand it and view its answers.
- You can add multiple questions and answers from the same container to a journey (more on journeys in the section below).
- Each added question or answer uses an AND condition (this means users must have interacted with all of them for the journey path to be valid).
View statistics for the entire page
The "Summary" container on the right shows combined statistics for all questions inside it:
- Total Visits
- Visits with Results Page
- Visits with Clickthroughs
- Revenue Referred
- Total Clicked Products
Revenue Referred is the total value of all clicked-through products, counted once per product per visit.
Analyzing a journey through your experience
A journey is a specific path a user can take through your experience — from the first question to the final recommendation or goal. It represents a real or possible sequence of questions and answers based on how your experience is built.
Building a journey means manually selecting a series of connected questions and answers to:
- focus on a specific use case,
- analyze how users interact with a particular flow,
- test or improve the experience of a targeted path.
Step 1: Open the experience flow
- Select an experience from the dropdown menu.
- Click any question to expand it. (By default, all questions are collapsed.)
When a question is expanded, outgoing and incoming routes from it are shown in semi-transparent blue, so you can see how it connects.
Step 2: Add the first question to the journey
- Click the funnel icon button on the question block to add the question to your journey.
- Once added, the question gets a blue border. It stays expanded, even if you click elsewhere.
Step 3: Add more questions to the journey
You can now add more questions that are directly connected to your current journey.
Expand connected questions by clicking them:
- If a question is eligible, its journey icon will be clickable.
- If it’s not part of the available flow, it will appear greyed out and can’t be added.
Step 4: Add answers to the journey
Once a question is part of the journey, you can also include answers from it:
- for single selection questions, click the journey icon on the answer block to add it
- for multiple selection questions, you can add more than one answer
For sliders, numeric inputs, or range questions, you can’t add answers — they are not supported in journey tracking.
Step 5: Analyze the routes
As you build your journey, you’ll notice different styles of routes:
- opaque blue: routes connecting selected questions in your journey (active flow)
- semi-transparent blue: possible routes from currently opened questions
- grey: all other routes, not part of the journey or an opened question
Step 6 (optional): Remove steps from the journey
- To remove a question or answer, click the journey icon again. You can also remove it in the overview tab.
- When removed, all routes going forward from that question block will also disappear.
View path statistics and most successful flows
This feature lets you see performance data for the entire experience—or for specific paths through it from the flow view. Use it to understand user behavior, spot drop-offs, and focus on what’s working.
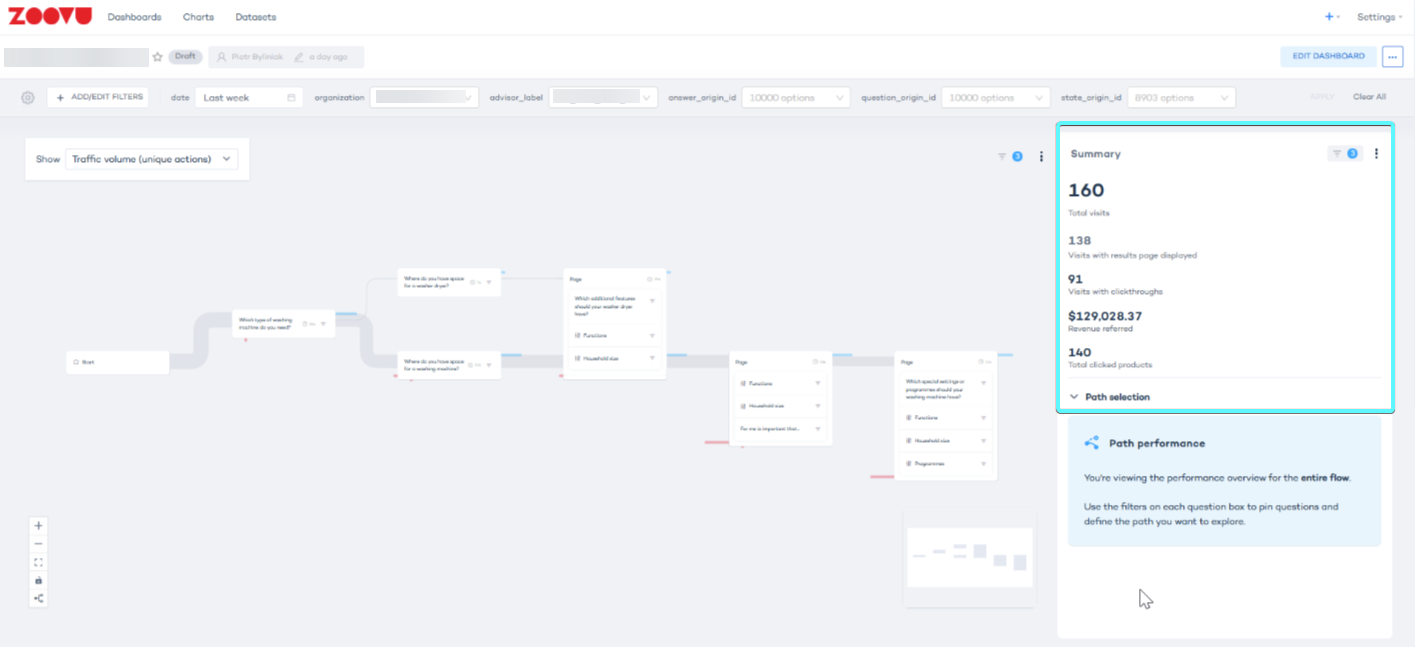
Step 1: Open experience insights
Go to experience insights for any published experience. You'll land on the overview tab, where you’ll see your experience flow in the center and a statistics widget on the right, which shows key performance metrics.
Step 2: Explore the default view
By default, the widget shows data for the entire experience, across all users and sessions. You’ll see:
- Total visits: how many sessions started
- Visits with results page: how many users reached a results screen
- Visits with clickthroughs: how many sessions included a product click
- Clickthroughs: total number of clicks across all sessions
- Revenue referred: estimated revenue influenced by product clicks
- Total clicked products: number of unique products clicked
- Average time spent: how long users spent in the experience
Step 3: Analyze specific paths
Click the cross-filter icon on any question or answer in the experience flow. This adds that question or answer to the path selection.
Once selected, the widget updates to show stats just for that path and the experience flow visually reflects your selection.
You can add multiple points to narrow your focus, or remove them one by one, to isolate how specific flows perform. For example, "users who selected budget laptops" or "users who skipped a question".
Step 4: Switch tabs and keep your selections
If you move to a different tab (like question performance) and come back to overview, your selections stay in place. You won’t lose your filters, so it’s easy to pick up where you left off.