Discovery Impact Report
The Discovery Impact Report helps you measure how Zoovu’s search and discovery experiences influence customer behavior and revenue. It tracks user journeys, engagement metrics, and conversion rates, giving you real-time insights into performance.
Use this report to compare customer interactions with and without Zoovu and see how AI-powered discovery improves the shopping experience.
If you want to activate the Discovery Impact Report for your account, please contact your Zoovu representative or send a message to the Customer Success Team.
Key performance indicators (KPIs) in the Discovery Impact Report
The Discovery Impact Report helps you understand how Zoovu contributes to your business by comparing key metrics with and without Zoovu.
Engagement and conversion metrics
- Total journeys – Total number of tracked user journeys within 24 hours.
- Engaged journeys – Number and percentage of journeys where users interacted with the website (e.g., page visit + button click).
- Total conversion rate – Overall conversion rate for all journeys.
- Engaged conversion rate – Conversion rate for engaged journeys only.
- Average order value – The average amount spent per transaction.
- Average products per order – The average number of products purchased per order.
- Distinct client count – Number of unique users (tracked via distinct IDs). Helps measure customer retention.
- A large difference between total journeys and distinct client count may indicate returning customers.
- Tracked revenue – Actual revenue generated.
- Cart abandonment rate – Percentage of users who added items to their cart but left without completing the purchase.
- Added at least one product to cart – Percentage of users who added at least one product to their cart.
User journey
A journey represents a unique visit by a user to the website within a 24-hour period, where their interactions are tracked.
A journey can include actions such as:
- Navigating between pages
- Clicking on buttons
- Using search
- Adding products to the cart
- Completing a purchase
Visit vs Journey
Visit – Every time a user enters the website, it counts as a new visit. If the same user leaves and comes back later, it will be tracked as another visit.
Journey – A journey represents a unique user session within a 24-hour period. If the same user visits multiple times in one day, it still counts as one journey.
Revenue and traffic metrics
- Revenue generated over time – Correlation between client visits and revenue over time.
- Revenue distribution – Checks if the 80/20 rule applies (80% of revenue coming from 20% of customers).
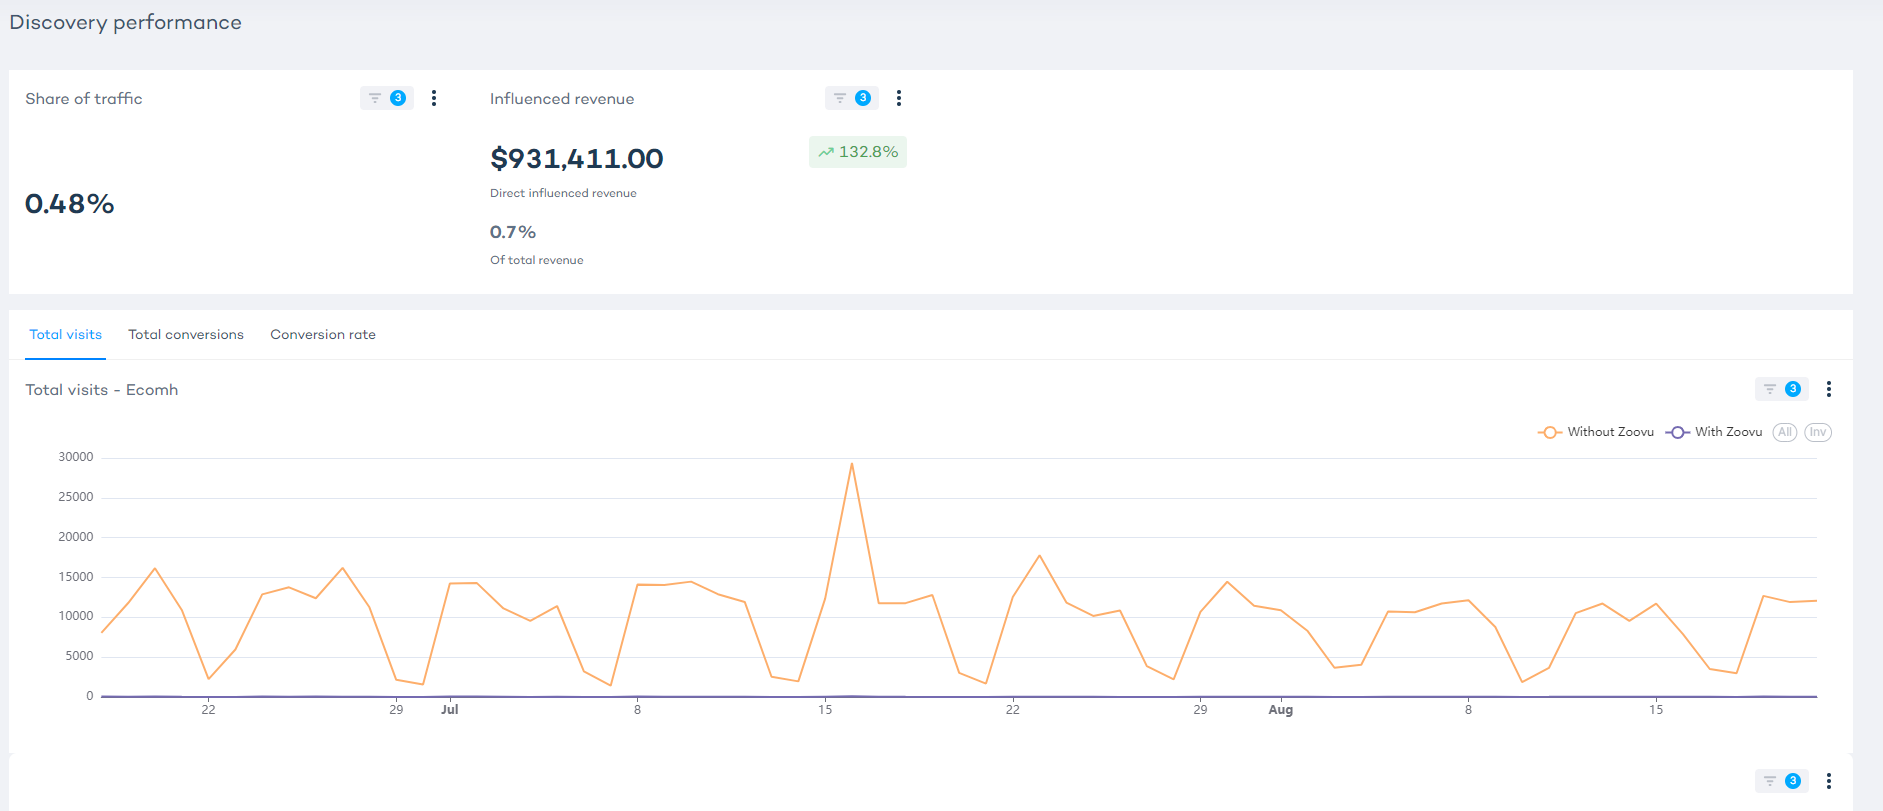
- Share of traffic – Percentage of website traffic that comes through Zoovu.
- Influenced revenue – Revenue generated by users who interacted with Zoovu assistants.
- Total visits, total conversions, and conversion rate over time – Compares these metrics with and without Zoovu.
- Performance table – Compares how user journeys with and without Zoovu assistants perform.

Search performance metrics
Search engagement and conversion metrics
- Search interactions – Percentage and number of engaged journeys that included a search.
- Search conversion rate – Difference in conversion rates between users who searched and those who didn’t.
- Search average – Average number of searches per session.
- Zero results – Average number of searches that returned no results.
- Conversion over time – Correlation of engaged/unengaged search journeys and their respective conversions.

Search clickthrough and revenue impact
- Total clickthroughs – Percentage of users who interacted with search and took action (e.g., clicked on a product or added an item to the cart).
- Product clickthroughs – Percentage of users who clicked on at least one product from search results.
- Category clickthroughs – Percentage of users who clicked on at least one category from search results.
- Add to cart (search results) – Percentage of users who added at least one product to their cart from search results.
- Direct influenced revenue by "add to cart" – Revenue generated from users who clicked "add to cart" directly from search results.
- Clickthroughs over time – Trends in add-to-cart, product clickthroughs, and category clickthroughs over time.
- Indirect add-to-cart – A product was added to the cart after a user clicked on a search result and navigated to another page, rather than directly from the search results page.
To make the most of your report, see our tips on navigating the reporting dashboards.