Zoe reporting
Zoe offers detailed reporting on how users interact with your AI assistant across different integration types: on a digital assistant, embedded on a product detail page (PDP) or syndicated with a retail partner. What data you see depends on whether tracking is turned on and where Zoe is used.
Tracking and data visibility
The available metrics depend on whether tracking is enabled:
| Source | Tracking | Metrics |
|---|---|---|
| Assistant | On | Conversions, Conversion Rate, Generated Revenue, Click-throughs, CTR, Referred Revenue |
| Assistant | Off | Click-throughs, CTR, Referred Revenue |
| PDP | On | Conversions, Conversion Rate, Generated Revenue |
| PDP | Off | – |
- Tracking must be turned on to see metrics like "Conversions," "Conversion Rate," and "Generated Revenue." Without it, only "Click-throughs," "CTR," and "Referred Revenue" are available for Assistant integrations.
- PDP integrations require tracking to show any data.
- If tracking is on and Zoe is used in both Assistants and PDPs, conversion metrics will be counted separately for each source.
When Zoe is used in a third-party environment (syndication), chat history and user engagements are still tracked. An engagement is recorded when a user interacts with Zoe by asking a question. However, revenue and conversion metrics are not available in syndicated setups, as the final transaction happens outside the Zoovu platform.
Filters
You can filter reports using:
- Zoe: Select the Zoe advisor instance.
- Source: Choose where Zoe is used (Assistant or PDP).
- Date: Select the time period to report on.
- Device: Filter data by device type (desktop, mobile, etc.).
- Locale: Apply filters based on language or country.
- Assistant: If "Assistant" is selected as the source, pick a specific assistant.
Metrics
-
Visit - One session of a user interacting with your site. A visit is reset after 2 hours of inactivity. All URLs on the same domain are treated as one visit (e.g.
www.site.com/page1andwww.site.com/page2count as the same visit). -
Engagement - A session where a user interacts with Zoe by asking at least one question.
Basic metric cards
-
Impressions - Total times Zoe was shown to users. Tracked only when Zoe enters the user's viewport.
-
Engagement Rate - Percentage of users who interacted with Zoe (asked a question) out of those who saw it.
-
Conversion Rate - Add-to-cart clicks per visit. Shown for PDPs and tracked Assistants.
-
Click-through Rate (CTR) - Product click-outs per product recommendation. Shown for Assistants without tracking.
-
Referred Revenue - Total value of products users clicked on. Shown for Assistants without tracking.
-
Generated Revenue - Total value of products users added to cart. Available for PDPs or tracked Assistants.
-
Average Duration - Time from first to last interaction with Zoe, averaged per session.
Traffic and engagement graph
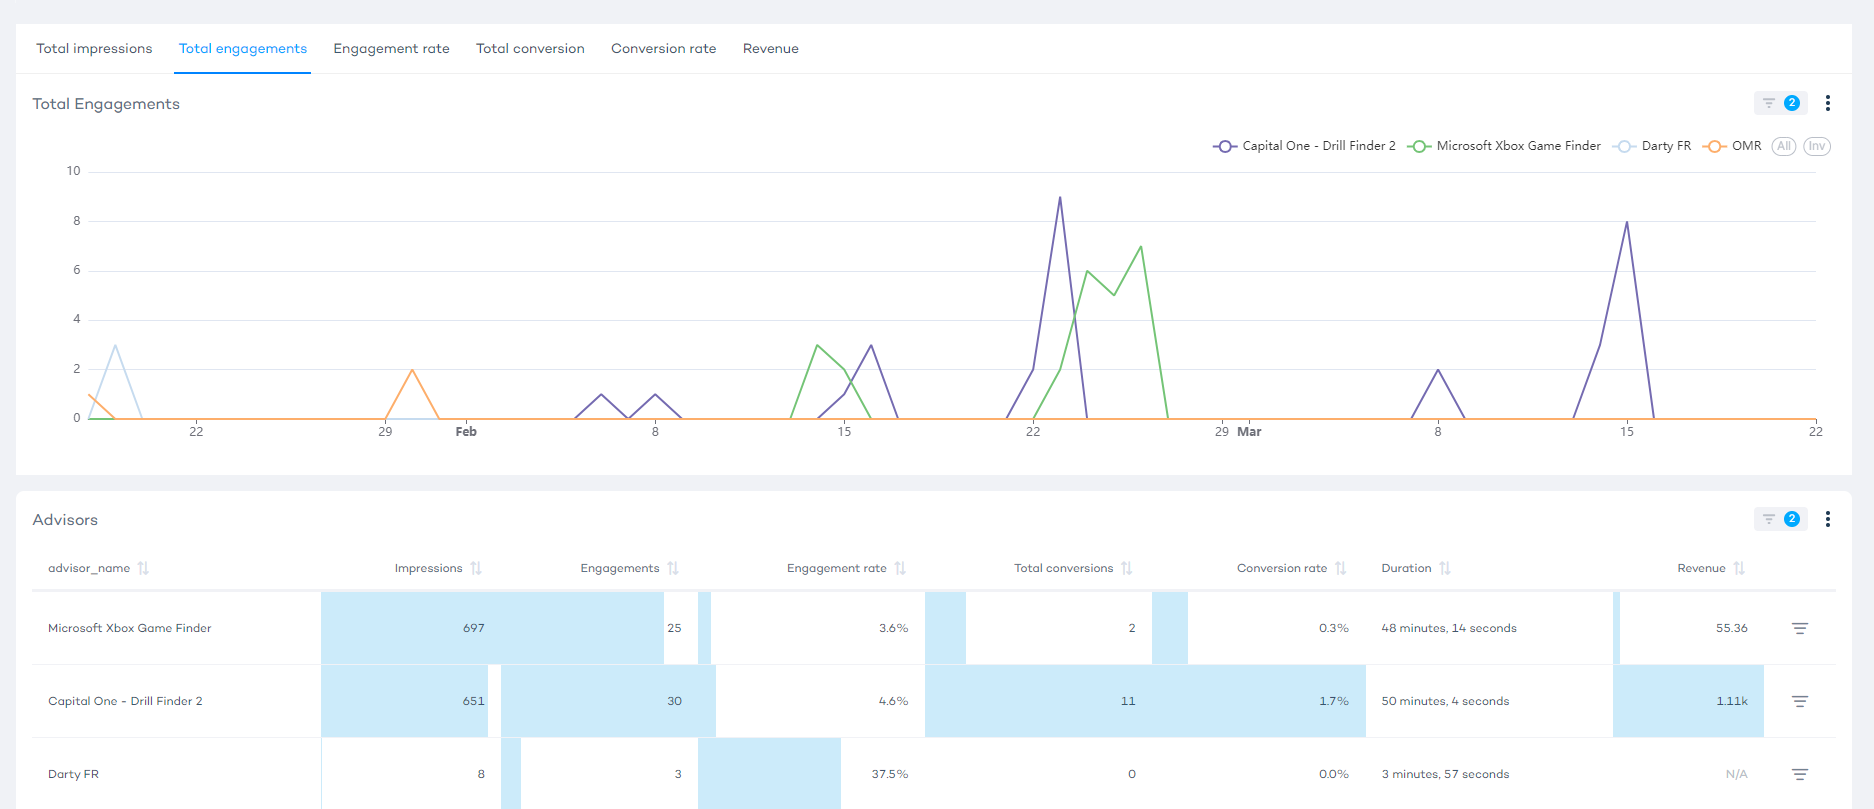
The line graph shows overall performance over time.

-
Total impressions – Number of times Zoe appeared in view.
-
Total engagements – Number of user interactions (e.g. questions asked).
-
Engagement rate – Percentage of impressions that led to engagement.
-
Total conversions – Number of purchase button clicks (add to cart).
-
Conversion rate – Percentage of visits that led to conversions.
-
Click-throughs – Number of clicks on “Go to product” (Assistants only, tracking off).
-
Click-through rate (CTR) – Percentage of product click-outs per recommendation.
-
Referred revenue – Value of products clicked (Assistants only, tracking off).
-
Generated revenue – Value of products added to cart (PDPs or tracked Assistants).
Keywords graph
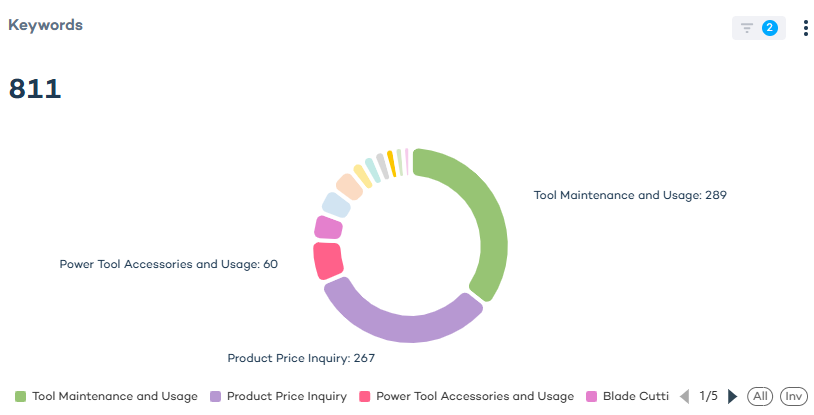
The keywords graph shows the most common topics users mentioned when chatting with Zoe.

Feedback graph
The feedback graph displays the ratio of positive to negative feedback from users. Feedback is given through thumbs up/down on Zoe’s responses.
Product insights table
The product insights table breaks down metrics for individual products:
-
Product name – Product name from your product catalog.
-
SKU – Product SKU from the catalog.
-
Impressions – Number of times Zoe showed up with this product.
-
Engagements – How often users interacted with Zoe on this product.
-
Click-throughs – Number of product page clicks (Assistants only, tracking off).
-
Conversions – Number of add-to-cart clicks (PDP or tracked Assistant).
-
Referred revenue – Value of clicked products (Assistants only, tracking off).
-
Generated revenue – Value of converted products (PDP or tracked Assistant).
Chat history
This section lists each user session:
-
Session ID – Unique identifier for each session.
-
Product – Product shown in the session.
-
Feedback – Positive vs. negative rating from the user.
-
Source – Where Zoe was used: Preview, Assistant, or PDP.
-
Click-through – Whether the user clicked on the product (Assistants only, tracking off).
-
Conversion – Whether the user added the product to cart (PDP or tracked Assistant).
-
Date – When the session happened.
-
Duration – Time spent interacting with Zoe (from first to last message).