Navigate the reporting dashboards
Your reporting dashboard is incredibly flexible and interactive. It allows you to see explore data from different perspectives, spot trends, cross-filter, compare, and see discover correlations.
The reporting dashboard provides various options to filter your data:
Filter the displayed data
1. Global filters: top navigation bar
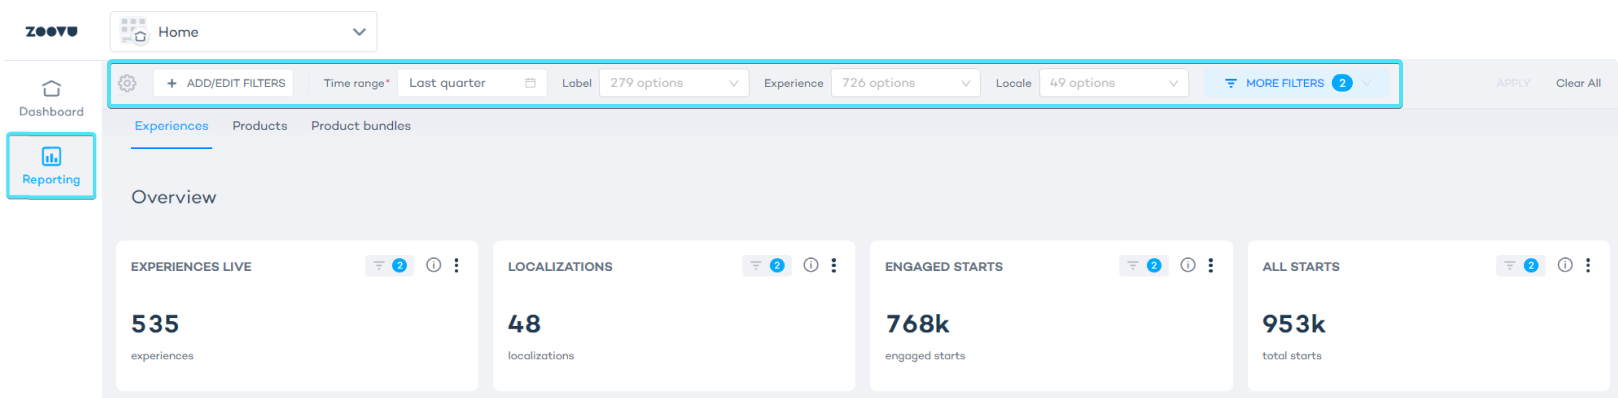
Filter by time range
Select the time range you want to explore, e.g. last quarter.
Range types:
- Last: Shows data from the most recent period (e.g., last 30 days for "last month").
- Previous: Displays the period before the current one (e.g., April if it's May).
- Custom: Lets you set a specific date range (e.g., January 1 to January 21).
- Advanced: Offers more detailed filtering options.
- No Filter: Displays all data without date constraints.
- Actual Range: Displays the start and end dates of the selected reporting period, excluding the end date itself.
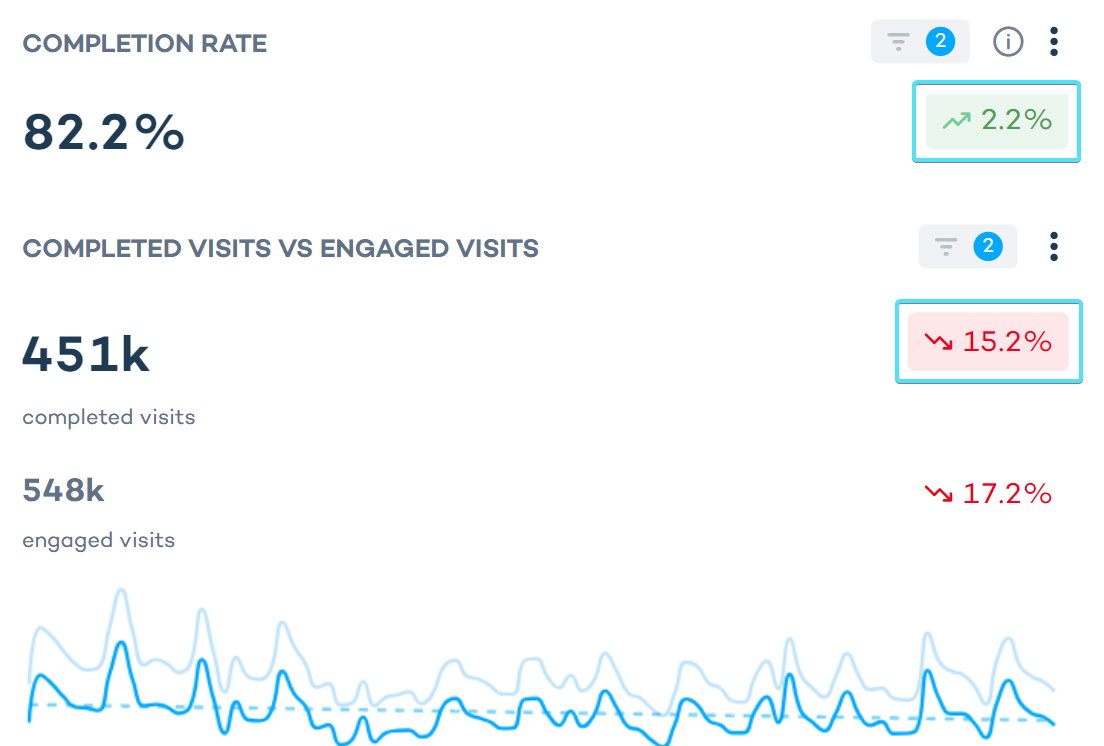
The trend boxes with percentages (e.g., 22%) show the difference between the currently selected reporting period and the preceding one. For example, if your filter is "last quarter," it compares the metrics from the selected quarter to the one immediately preceding it.
- Filter by labels: If you have labelled your digital experiences, you can filter by labels you want to explore.
- Filter by locale: Select a specific locale or choose "Select All" to include data for all locales.
- Filter by device: Filter the data based on the device type used by your visitors.
- Currency selector: Select one of the supported currencies to convert and display the data in the selected currency.
Hover over the funnel icon in any chart to see the currently applied filters:
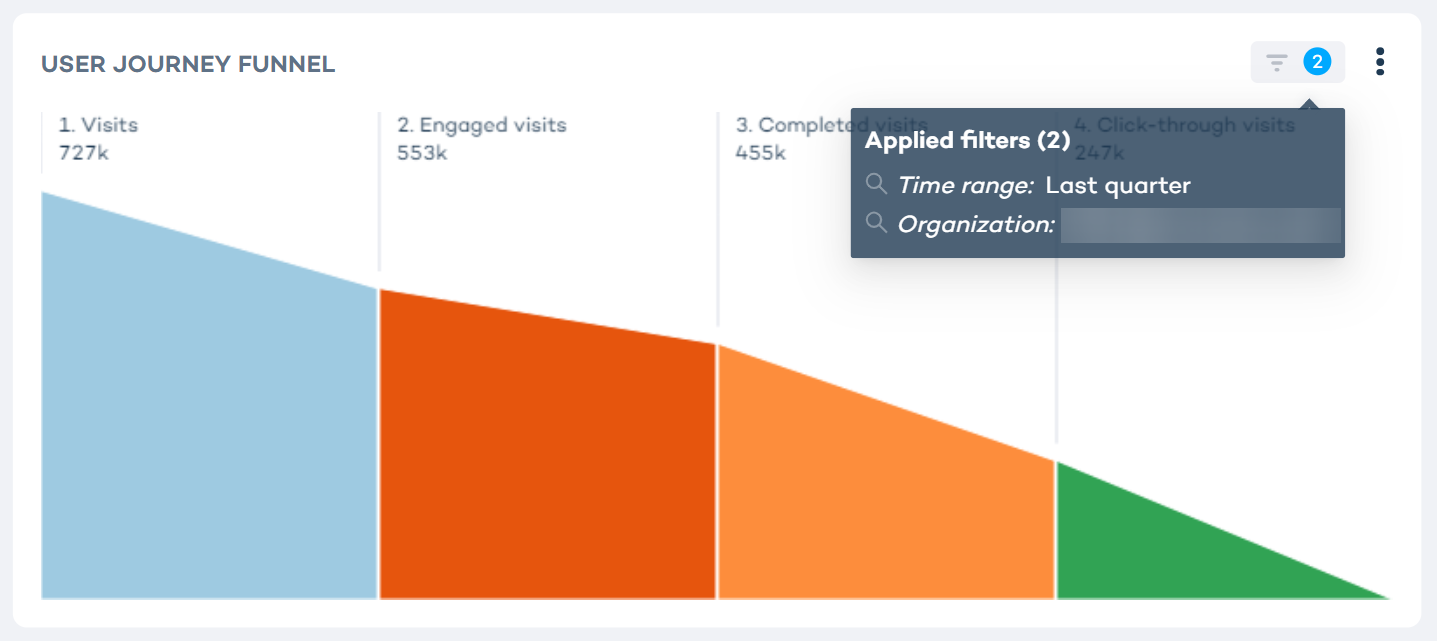
After configuring your filters, always click "Apply" in the top right corner to update your dashboard with the selected filters.
Cross-filter to explore data
Cross-filtering lets you refine your data analysis interactively across multiple reports at once. This means you can explore specific aspects of your data simply by selecting criteria in one part of the report. As a result, other reports will update instantly to show the filtered subset of data, helping you gain insights quickly and effectively.
Reports that support cross-filtering are marked with a "🔄" icon.
This example shows how you can filter and view the data for a specific region. As you select the country within the chart, the values in related reports will reload to display data for the selected subset:
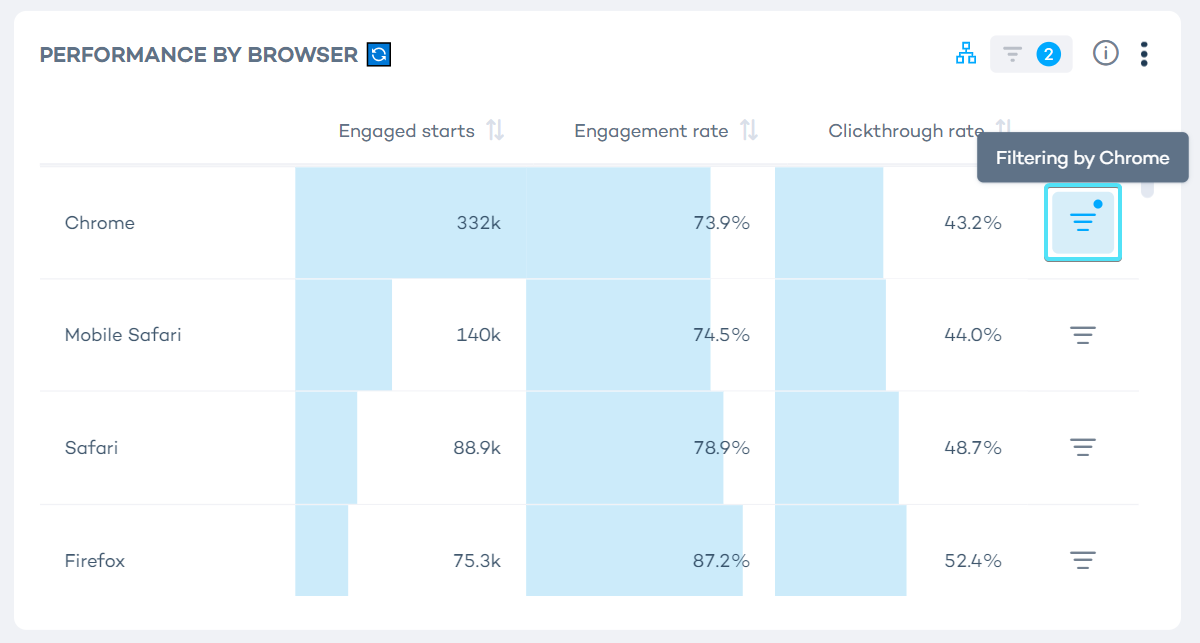
Filter directly from the chart
The on-chart controls allow you to quickly filter data at the chart level. Filtering data here will update related charts.
To filter directly from the chart, click the filter icon.
An active filter will be marked by a blue dot and listed in the filter bar on top of the dashboard.
This example shows how you can filter the data to only show data from users who have used the browser “Chrome”:
Invert inclusion
Using the "All" and "Inv" options, you can include or exclude specific data subsets in a chart.
- The "All" option allows you to include all available data. You can use "All" to perform a bulk action and select all filters at once.
- The "Inv" (invert) option allows you to exclude data from the chart view. When you choose to invert a filter, the dashboard shows data that does not match the selected filter criteria. You can use "Inv" to perform a bulk action and deselect all filters at once.
In the example below, you can see how "All" and "Inv" can be used to select or deselect the browsers in a chart:
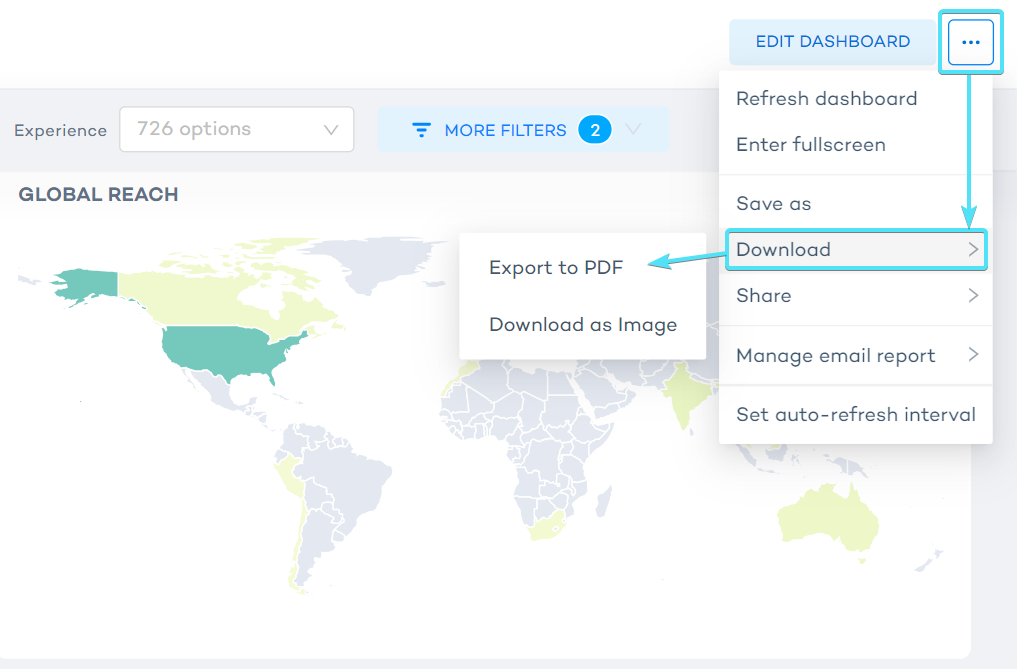
Download reports
Downloading reports in different file formats allows you to analyze, share, and present data conveniently across various platforms and applications.
To download reports as CSV, Excel, or image files from the dashboard, follow these steps:
- Navigate to the report or dashboard section containing the data you want to download.
- Locate the three-dot menu icon in the top-right corner or near the report.
- Click on the menu icon to reveal a dropdown list of options and select “Download”.
- Select the desired file format (CSV, Excel, or image) from the available options.
- The file will be generated and downloaded to your device automatically.