Analytics in Search Studio dashboard
The Dashboard Analytics provides an overview of how users interact with your search function. You can track search performance, identify common queries, and optimize the search experience based on these metrics.
To view the dashboard, go to Search Studio > Analytics.
Selecting a date range
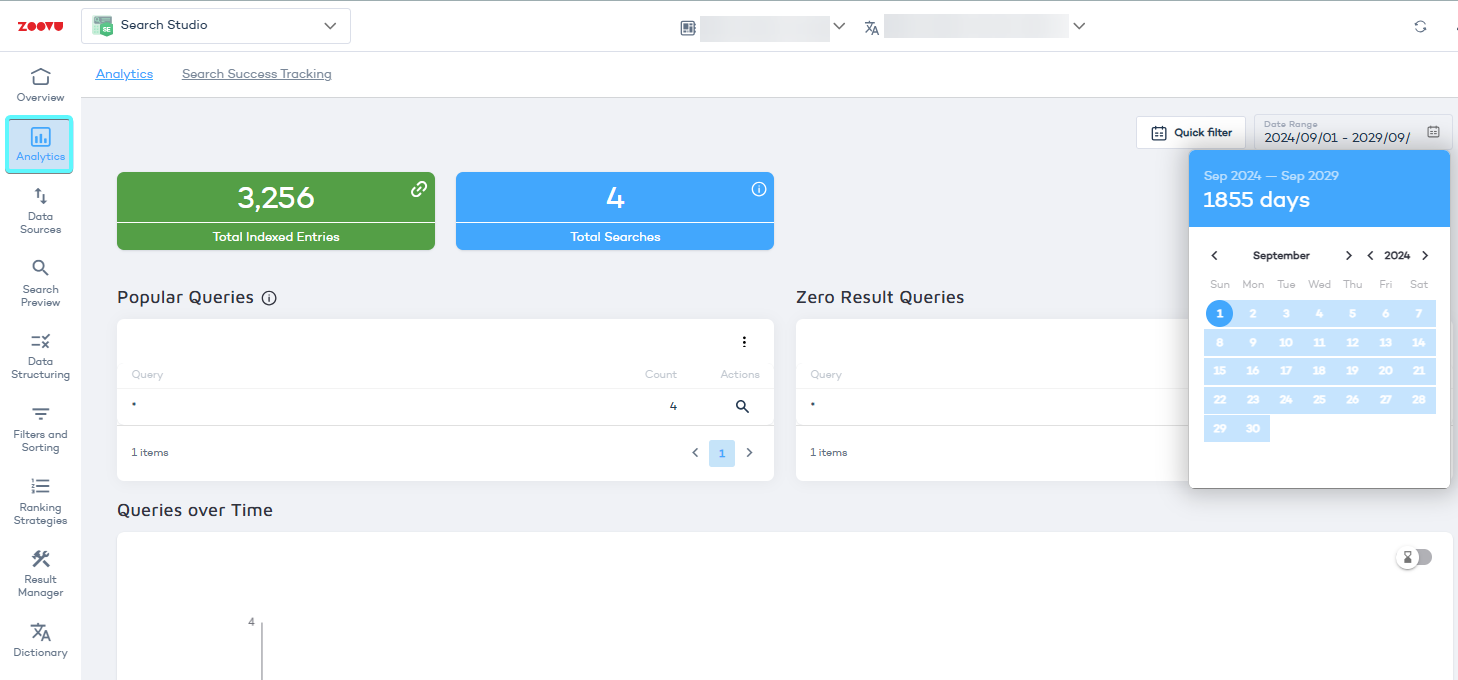
Use the date picker in the top-right corner to select a time period for the analytics.
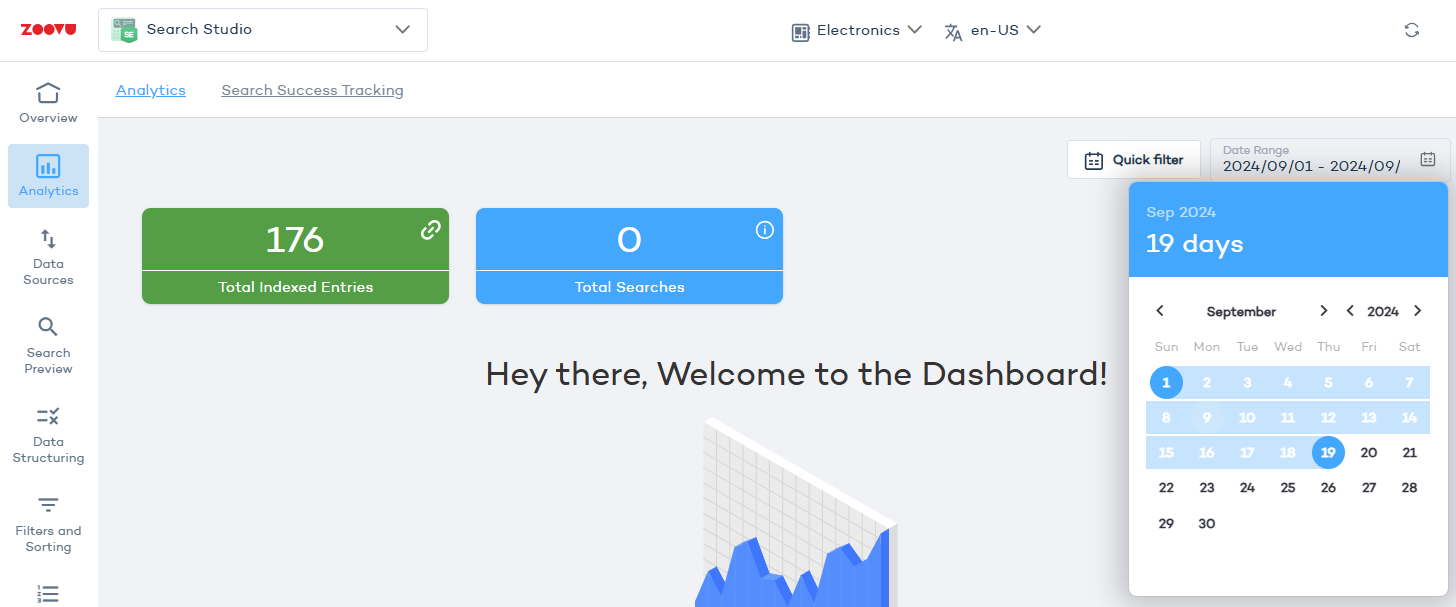
To view data for a single day, pick the same date for both the start and end.
Exporting and navigating data
- Use navigation arrows to browse through pages of data.
- You can click Export to download CSV reports for selected metrics.
Search metrics
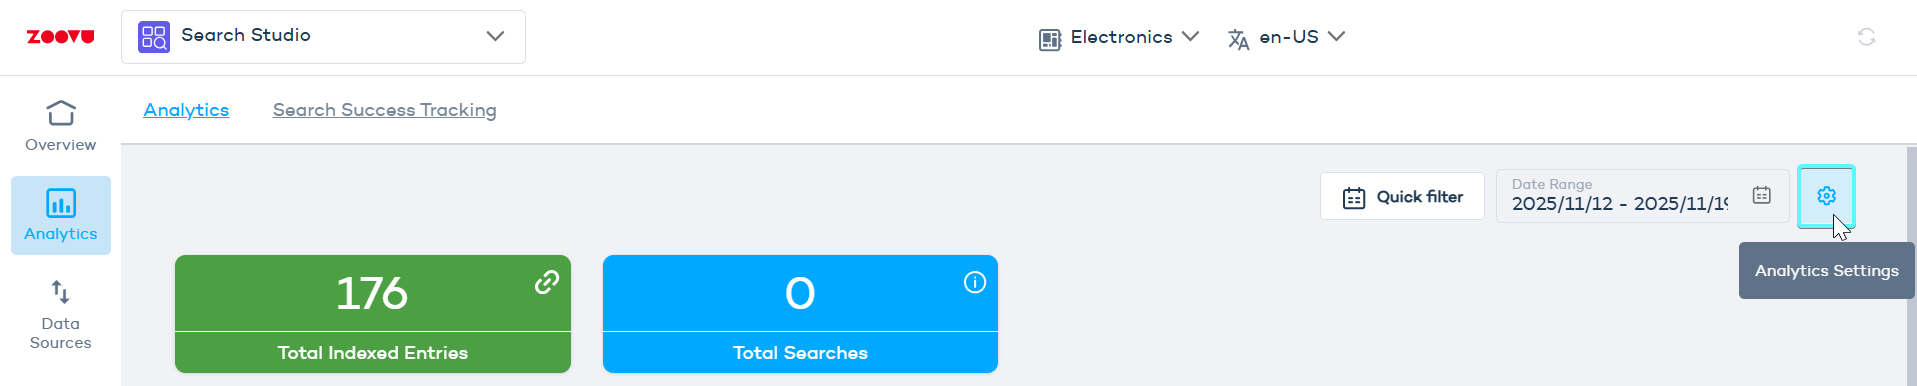
At the top of the dashboard, you will see four key metrics:

- Total Indexed Entries – The number of pages currently indexed. This number increases whenever you launch re-indexing after adding new pages your domain.
- Total Searches – The number of times users entered a query and hit “Enter” during the selected date range.
- Search Sessions – The number of users who performed at least one search, shown as a percentage of total users.
- Searches per Session – The average number of searches each user performs in a session.
Popular queries
This section shows the most frequently searched terms. It helps you understand what users are looking for and identify opportunities to improve search relevance.
Count refers to the number of unique searches for each query, not the total number of times the query was entered.
Frequent zero-result queries
This section highlights search terms that returned no results.
If the same queries appear here often, consider adding synonyms, adjusting mappings, or expanding indexed content.
Use Result Mapping or the Dictionary to resolve these issues.
Popular results
Popular Results are the search results that appear most frequently when users submit queries.
Use this data to understand which products or content are most relevant to user searches.
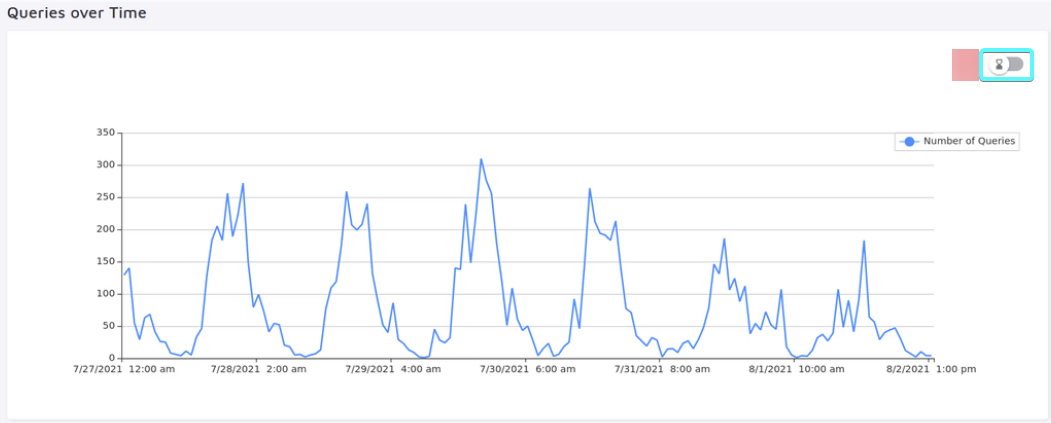
Queries over time
This graph shows search activity across different times. It helps you identify peak search times and schedule maintenance or re-indexing during periods of lower activity.
Toggle between hourly or daily views using the hourglass icon.
All queries
View all queries submitted within the selected time frame. You can search, sort, and filter data by these metrics:
- Searches – Total number of times a query was searched (includes repeated searches).
- Unique Searches – The number of unique times a query was searched (excluding duplicates from the same user).
- Results – The number of results returned for each query.
- CTR (Click-Through Rate) – The percentage of users who clicked on a result after searching.
Click "Show Details" to get more insights:
- Abandon rate – How often users leave the search without clicking a result.
- Previous & next queries – Shows what users searched before and after this query.
- Filter usage – Displays the most common filters applied to this query.
- Values extracted via Data Points – Shows additional details based on indexed data.
Tracking search suggestions and autocomplete performance
Queries Leading to Clicks on Top-Suggested Results
If search suggestions are enabled, this section shows which queries lead to users clicking on an auto-suggested result.
Search suggestions are processed separately from full search results and do not count towards your search quota.
Results opened from search suggestions
Tracks which suggested results users click on most frequently.
Query Suggestions Clicked (Autocomplete Searches)
Shows the most clicked autocomplete queries. This includes both automatically suggested queries and manually curated lists.
You can configure Autocomplete either by enabling popular searches to show automatically or through a manually-curated list of queries.
Queries Triggered from Search History
If search history is enabled, this section shows the most frequently clicked past searches.
Improve search with Success Tracking
To get deeper insights into search performance, consider enabling Search Success Tracking. This tool helps evaluate critical search metrics:
- Click-Through Rate (CTR) – How often users click a result.
- Search Session Rate – How often users engage with search.
- Filter Rate – How often filters are used.
- Zero Result Rate – How often searches return no results.
- Abandon Rate – How often users leave without interacting with results.
Monthly Insights Digest
If you want us to email you your Search Insights Digest each month, go to Analyrics > Settings and fill out the email address:
You can also add other recipients from your team.
