Reporting dashboard
Zoovu Reporting is your central hub for all analytics and performance metrics. It contains several dashboards and reports, each providing unique insights into different aspects of your discovery experiences.
- Explore our tips on navigating the reporting dashboards.
- Understand the data in your reporting dashboard.
To access the reporting dashboards:
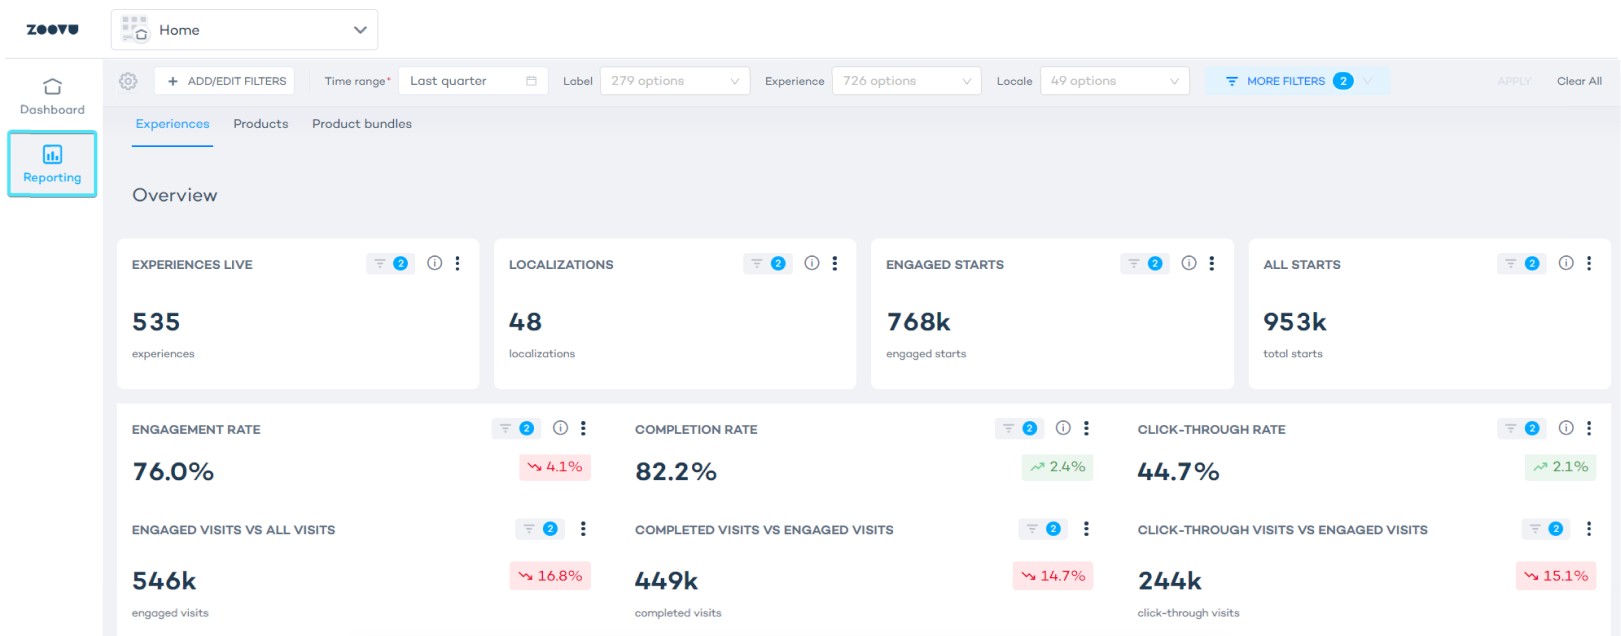
- select “Home” in the menu dropdown,
- click "Reporting" in the left navigation bar.
Dashboards: Experiences, Products, Bundles, Syndication
Depending on your subscription, these are the dashboards available to you:
Experiences Dashboard
| Section | Description |
|---|---|
| Overview | In the Overview section, you’ll find a snapshot of how your experiences are performing. This report displays important metrics such as engagement and completion rates, helping you see how users are interacting with your discovery experiences. |
| Visitors and Device Usage | This section provides information about your customers’ engagement with your experiences and the devices they use. This information can help you optimize your discovery experiences for the most popular devices. |
| Behavior and Reach | Here, you can gain insights into the effectiveness of the user journey, the extent of your global reach, and explore evolving behavioral trends. |
| Browser and Technology | This section analyzes performance metrics by browser, highlighting the distribution and overall performance across different browsers. |
| Sales Performance | This section provides a detailed analysis of your sales performance, highlighting metrics such as revenue referred and revenue generated. By monitoring these metrics, you can identify which experiences should be refined to enhance sales performance over time. |
| Experience Performance | Get a detailed analysis of each discovery experience. Use this to compare different experiences, see what's working, and make informed decisions to boost overall performance. |
Reporting is not available for Visual Configurators yet.
Products Dashboard
| Section | Description |
|---|---|
| Overview | The Overview section provides a snapshot of your product performance, displaying how much revenue is being referred through different actions, such as product detail page click outs, add-to-cart clicks, or PDF exports. This helps you understand which actions are driving your sales and gives you a quick view of your overall performance. |
| Product Performance | The Product performance section breaks down the statistics for each individual product, helping you track customer engagement levels and identify which products are resonating the most with your customers. |
Product Bundles Dashboard
| Section | Description |
|---|---|
| Overview | The Overview section gives you a clear picture of the effectiveness of your bundling strategy. You can see the total number of bundles configured and their average size. |
| Bundling Performance | This section dives deeper into the details of your product bundle performance. You can explore and assess all your bundles, listing individual products included in each bundle. You can sort the data by locale, device, browser, set size, and the number of times each bundle has been configured. This lets you identify popular bundles and how various factors influence their performance. |
Syndication Dashboard
| Section | Description |
|---|---|
| Overview | In this section, you can see how your syndicated experiences are performing across different syndication partners. Here, you can see key metrics such as the number of live experiences, engagement, and completion rates. |
| Visitors and Device Usage | This section provides information about your customers’ engagement and the devices they use. This information can help you optimize your discovery experiences for the most popular devices. |
| Behavior and Reach | Here, you can gain insights into the effectiveness of the user journey, the extent of your global reach, and explore evolving behavioral trends across your syndicated experiences and syndication partners. |