Conversational Intelligence
AI Insights helps ecommerce teams understand shopper behavior, product interest, and traffic patterns. You can ask direct questions about performance and receive clear visualizations that support day-to-day decisions, weekly reporting, or long-term planning.
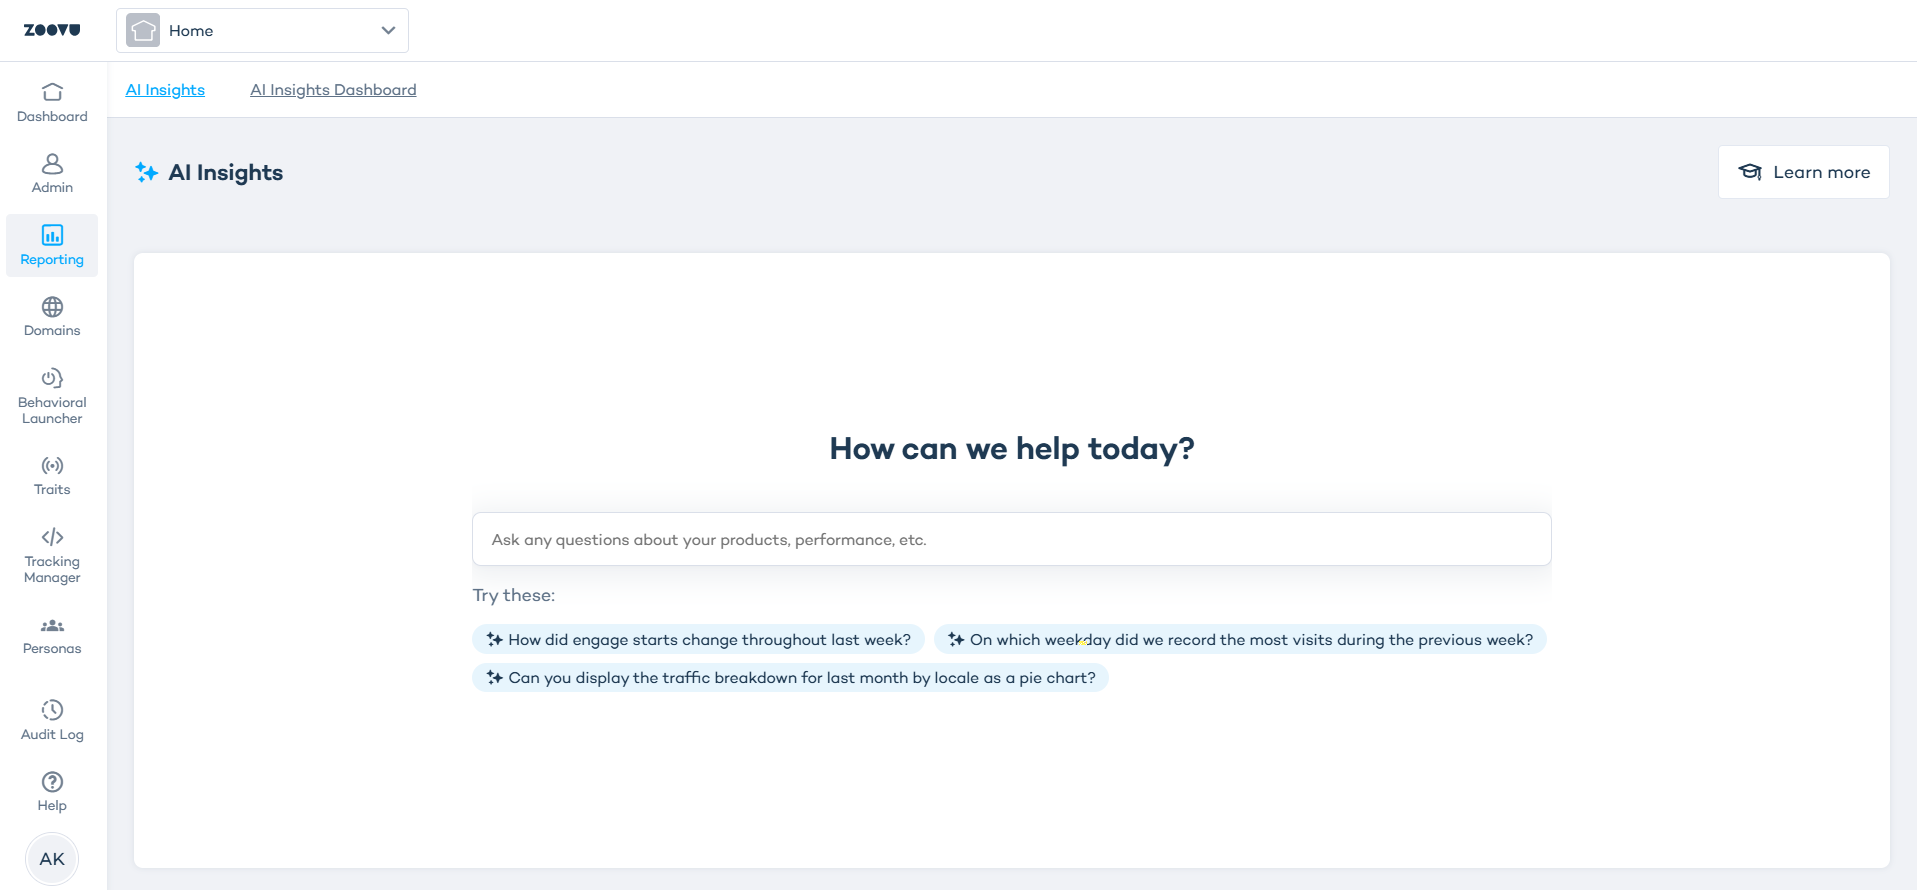
Step 1: Ask a question
Type a question about your ecommerce performance. AI Insights reads your data and returns a chart that highlights the trend or metric you need.
Example questions:
- Which weekday delivered the highest traffic from our key markets?
- Show the traffic breakdown by locale for last month as a pie chart.
Each question should focus on one topic at a time.
Step 2: Create a report
- Every chart has a Create report icon. Click the icon to turn the chart into a saved report.
- Select Create to confirm.
- Your report appears in Zoovu Home > Reporting > AI Insights Dashboard.
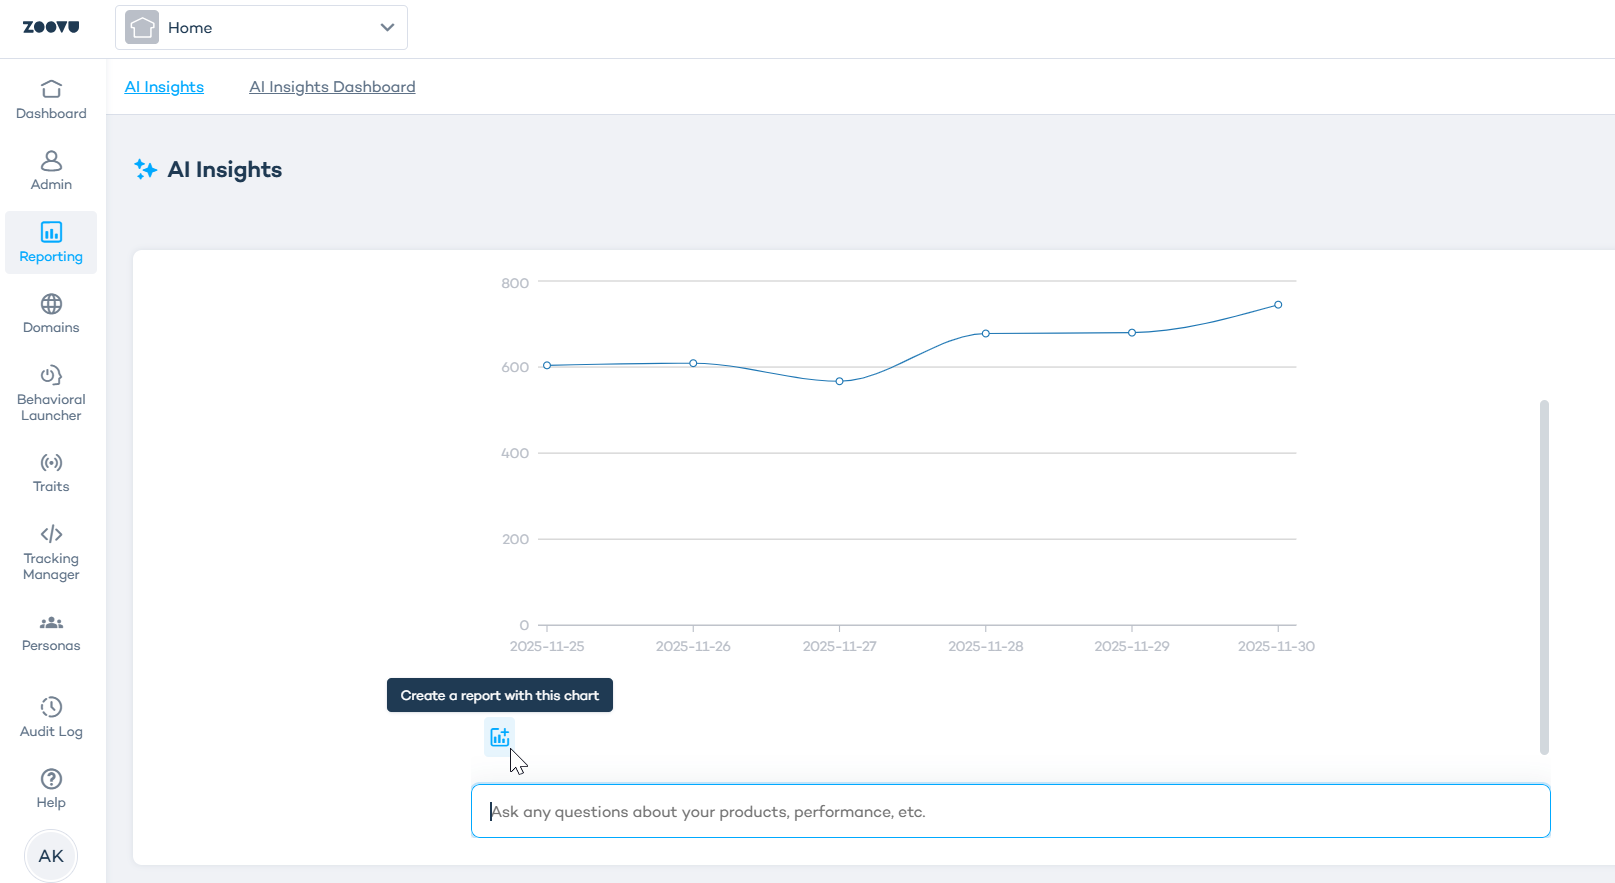
Do not leave or refresh the page while a report is generating. A refresh starts a new session.
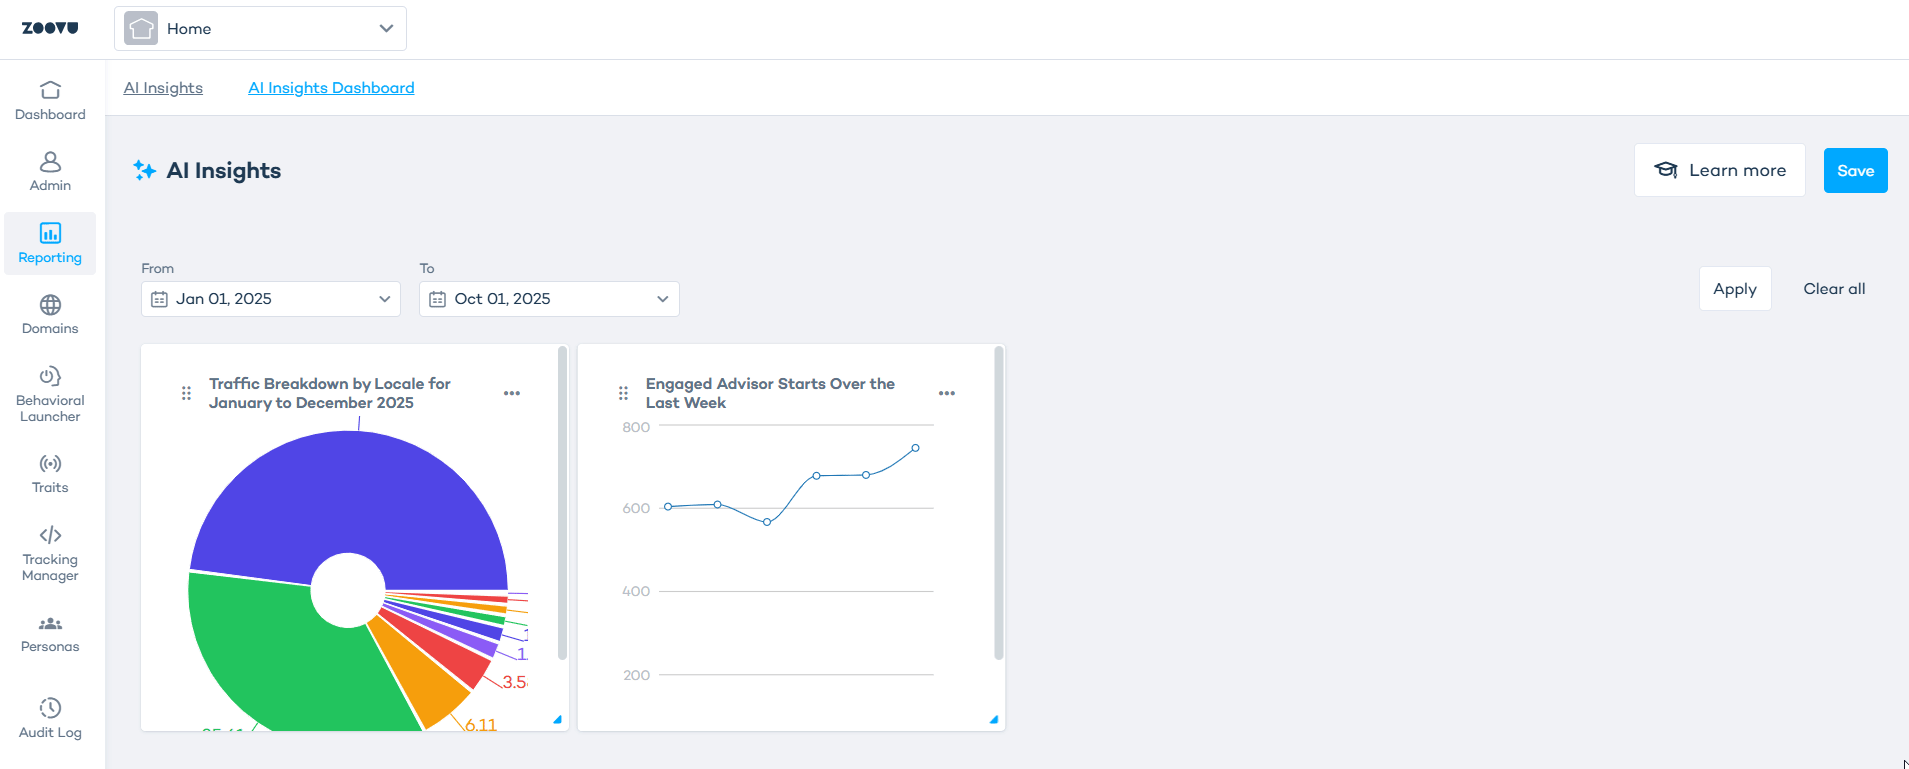
Manage your dashboard
Your AI Insights Dashboard stores all created reports. It is designed for ecommerce teams who monitor metrics across markets, products or campaigns.
Reorder charts
- Drag a chart using the handle in the top-left corner.
- You can resize any chart by dragging on its edge.
- To delete a chart, open the menu (three dots) and select Delete.
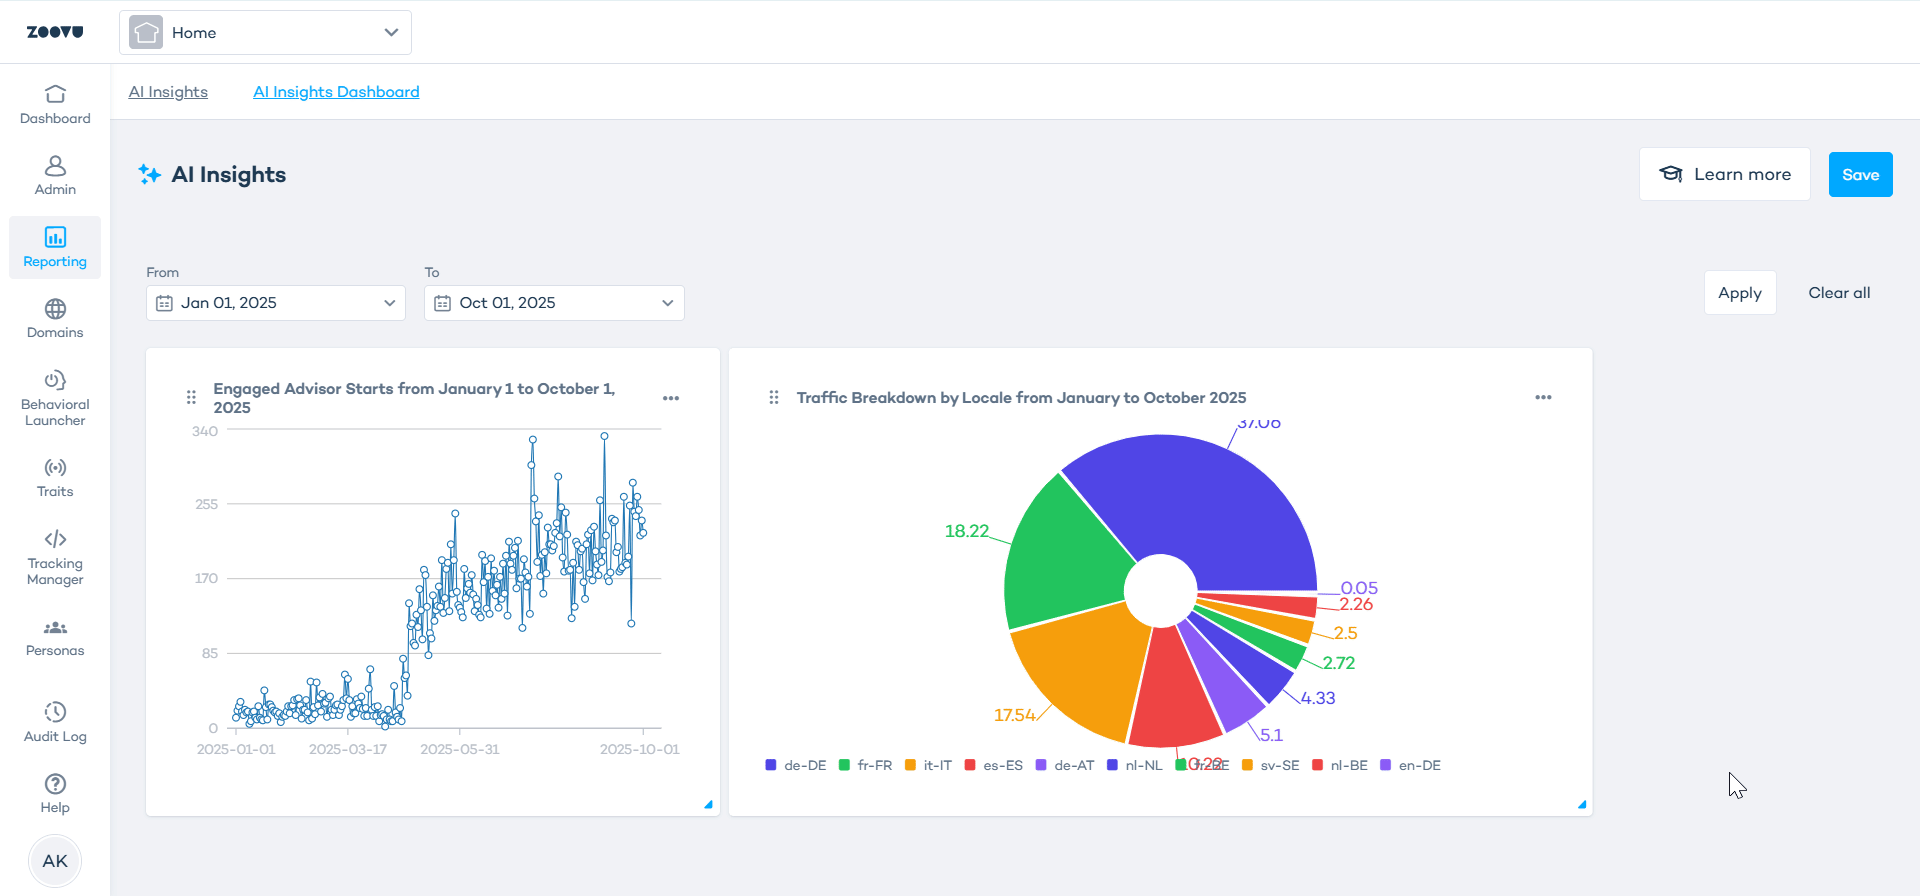
Filter by date
Use the date range above the reports to choose a specific period, then select Apply.
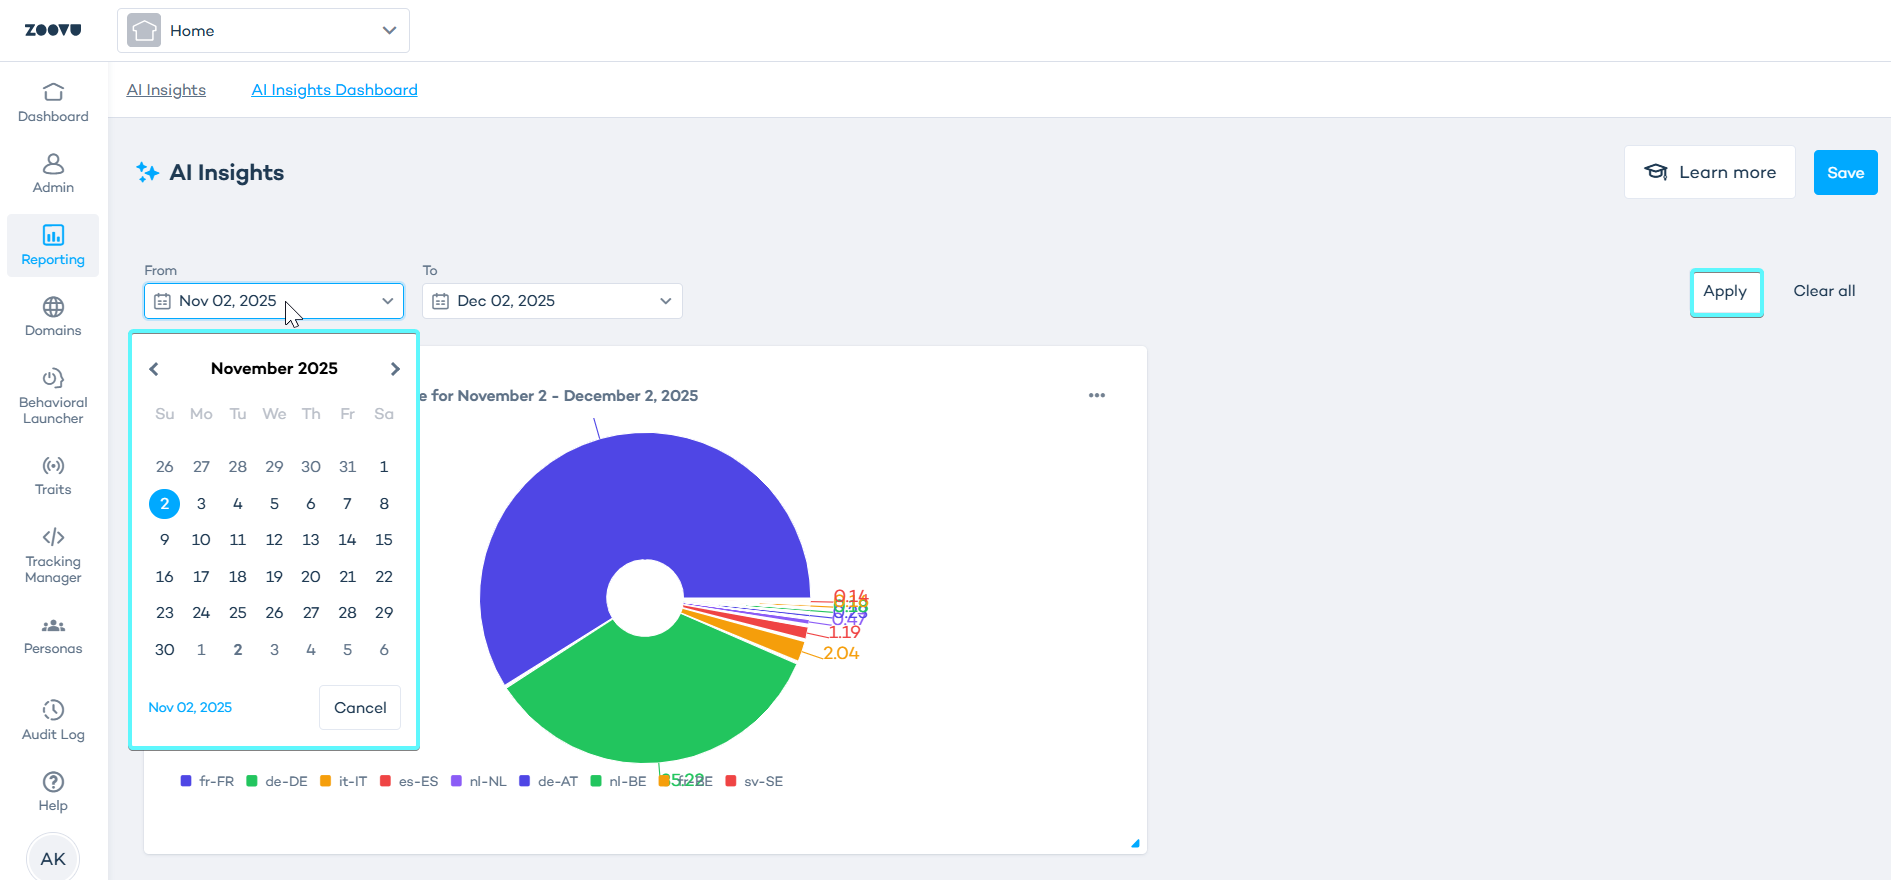
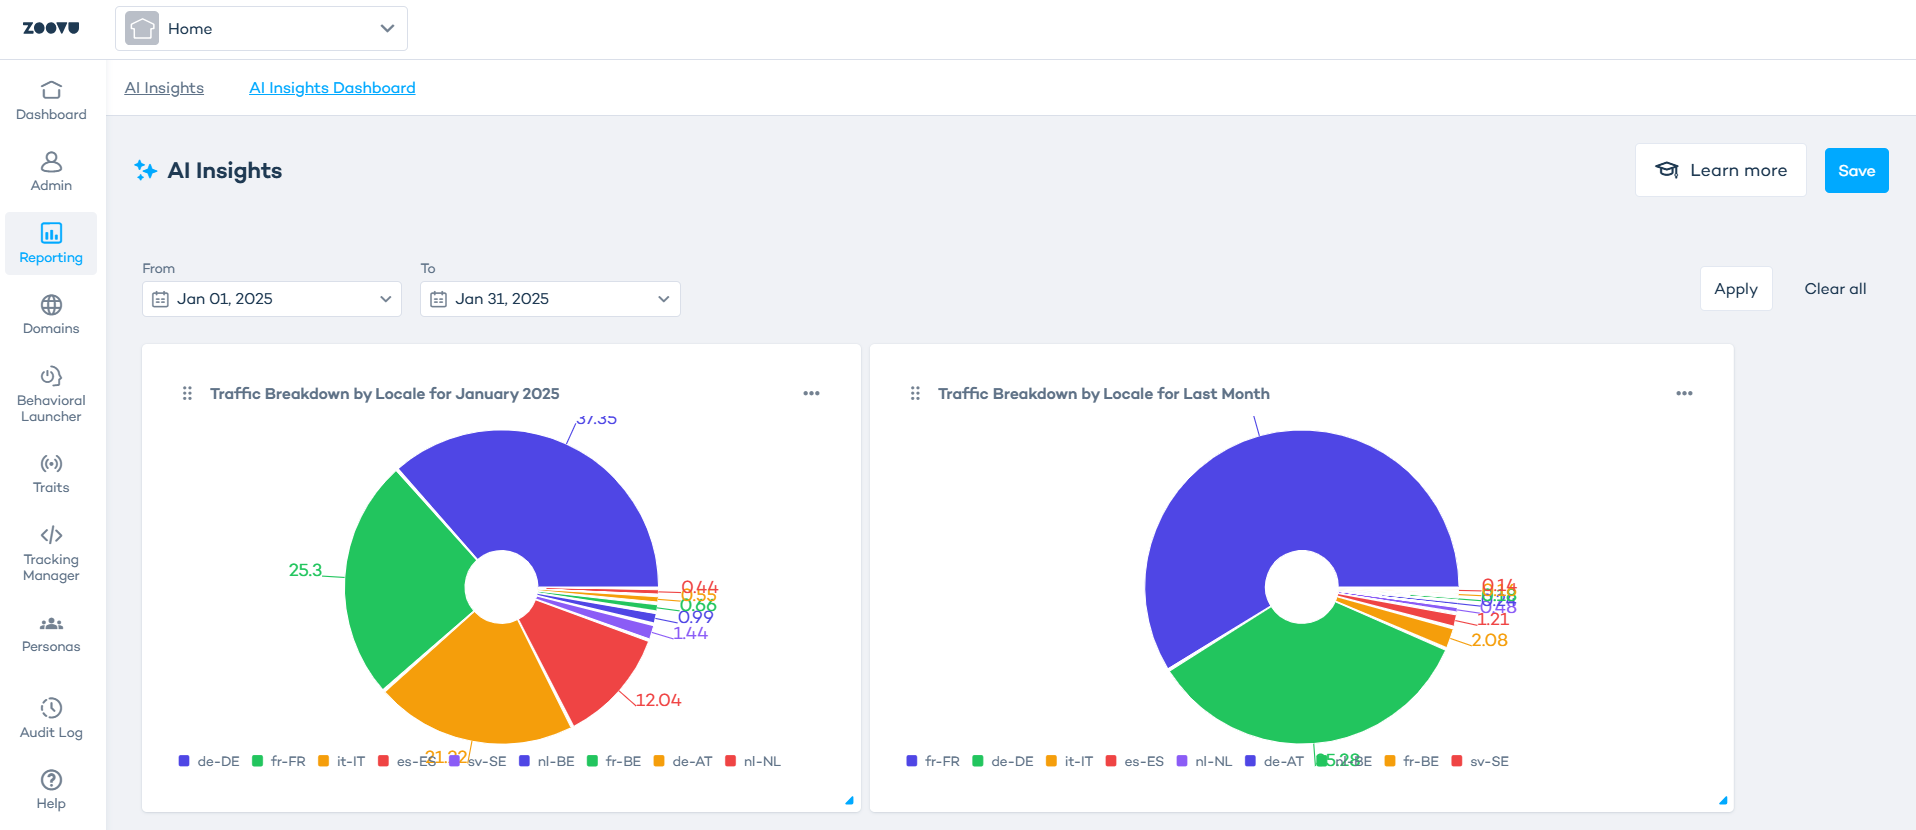
Exclude a chart from filters
If one chart should stay unchanged when you update the date range:
- Select the chart’s menu (three dots).
- Choose "Exclude from filters".
Example: Compare two time periods
For example, to compare traffic for Q1 vs. Q2:
- Create two charts of the same type (e.g. Traffic breakdown).
- Exclude one chart from filters.
- Change the date range and apply the new period.
You will see two charts side by side showing performance across both periods:
Best practices
Use these tips to get clearer answers and make the most of Conversational Intelligence.
- If you do not mention a time period, the default is the last 30 days.
- Ask one thing at a time. Each question returns one answer or one chart.
- If you want a specific output, ask for it directly. For example: line chart, table, pie chart, or CSV-ready data.
- If your data set is large, narrow the request. Asking for a top 10 is often the fastest way to get a useful result.
- A single session keeps context for roughly 20 messages, so shorter focused threads work best.
- For period-over-period comparisons, create the charts you want to compare and exclude one of them from the date filter so it stays fixed.
- Export the data if you want to explore it further in your own tools.
- Stay in the chat until you have asked all your questions and generated the charts or data you need. If you switch to the Reports tab, the session restarts. Once you are done, open the Insights Dashboard to find the saved assets and use them in reports.