A/B testing for Digital Assistants
A/B testing helps you compare different versions of your Digital Assistants to see which one performs better with your customers.
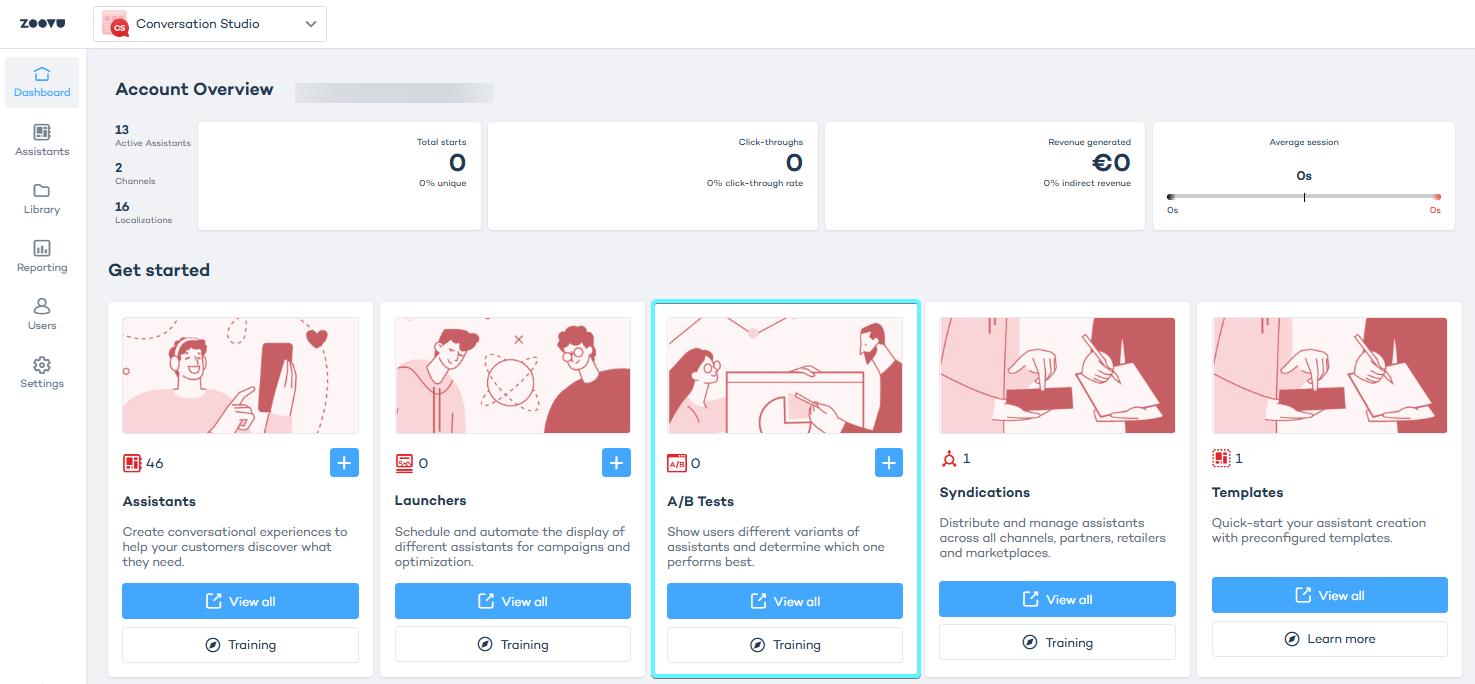
Access A/B tests
- Log in to Conversation Studio.
- In the dashboard, open the A/B Tests tab or simply click "+" to get started.
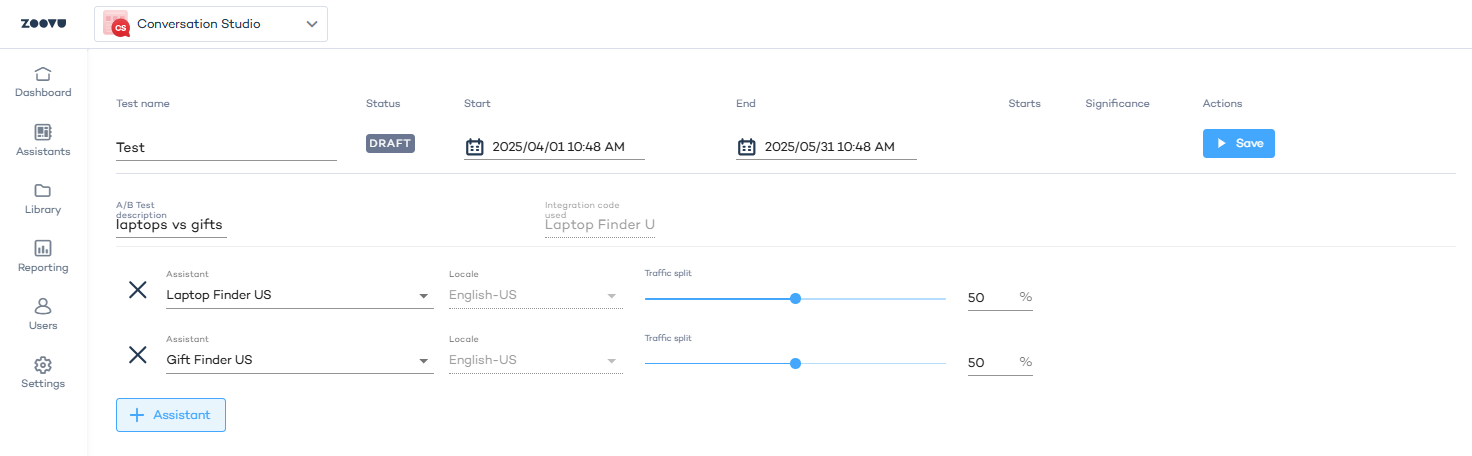
Create an A/B test
- In Conversation Studio > A/B Tests, click the "+" button to create a test.
- Enter a name that clearly identifies what you're testing.
- Set a start and end time for the test. Keep in mind that data collection starts from the first full day after the test begins.
- (Optional) Add a description to clarify the test purpose for you and other stakeholders.
- Click "+ Assistant" to select at least two assistants for the test. The latest published versions of the assistants will be used. The assistants must share the same locale, e.g. en-US.
- Set traffic distribution between assistants. The default split is set to 50/50. Learn more.
- Click Save to start the test.
For the best comparison, keep the differences between assistants minimal. Instead of creating two assistants from scratch, duplicate an existing one and make small changes - so that only the intended changes impact the results.
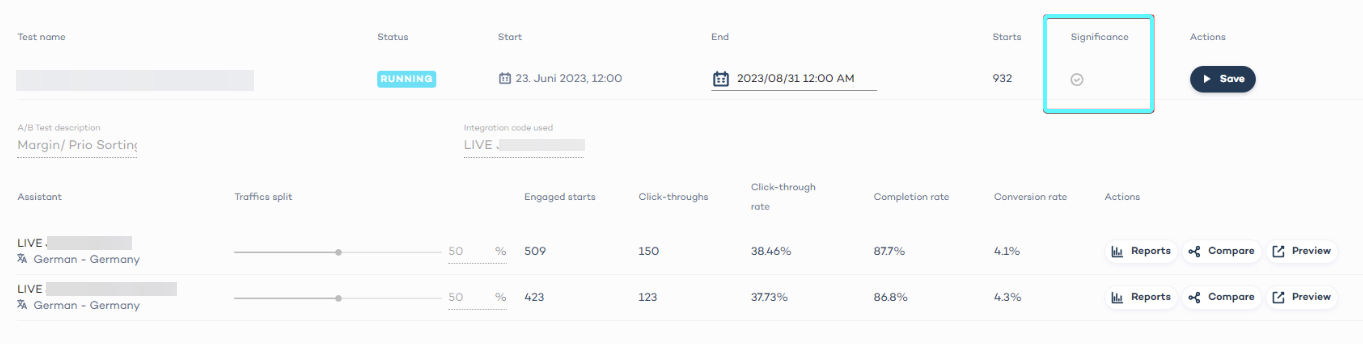
Test results
Once your test has enough data, click View to see results for each assistant. Key metrics include:
- Zoovu starts – How many visitors interacted with the assistant.
- Click-through rate – Percentage of visitors who completed all questions.
- Completion rate – Percentage of visitors who reached the final step or selected a product.
- Conversion rate - Percentage of visitors who selected a product.
Understanding statistical significance
The Significance icon in the A/B testing dashboard lights up when results reach 95% confidence. This means there is strong statistical evidence that one assistant is performing better than the other.
How the 50/50 split works
- When traffic is split evenly (50/50), each assistant has a weight of 0.5.
- The system assigns visitors based on a random number between 0 and 1:
- Assistant A gets assigned to the range [0.0, 0.5).
- Assistant B gets assigned to the range [0.5, 1.0).
If the random number is 0.4, the visitor sees Assistant A. If the number is 0.51, they see Assistant B. Over time, this results in an even distribution of visitors between assistants. Logs confirm that the randomization process works correctly, with a near-perfect 50/50 distribution over seven days.
Compare assistants
To compare insights side by side:
- Click the Compare button next to an assistant.
- The system will compare it with the next assistant in the list. You can change the comparison target from a dropdown menu.
- The canvas displays both assistants with their flow insights for easy analysis.
Finish and delete the A/B test
To stop a test early, click Finish. Once finished, you can delete it if you no longer need the data.
While a test is running, you cannot delete it or publish a new version of any tested assistant.